
Variation
All natural processes are affected by intrinsic variation. In nature, no matter how hard we try, there can never be two identical actions that generate exactly the same result.
This simple statement contains a deeper truth that is connected with change and entropy (a measure of disorder in the environment).
Change is a constant in nature that is not only necessary but literally vital. There would be no life without change.
How does this intrinsic characteristic of nature affect the activities of an organization?
By definition, an organization (system) is a set of interdependent individuals and activities that work together to achieve a well-defined goal.
Each of the activities that make up the organization and every individual are affected by variation, and this variation influences the possibility of achieving the goal.
Any study we make of variation is aimed at understanding it and reducing it, whatever it concerns, be it improvement of production or monitoring of incoming cash.
In order to have information that can be used to make the right decisions, we need a technical tool and the right mindset. We find both of these within Statistical Process Control (SPC), introduced by W. Shewhart in the first half of the 20th century. This period saw the birth of the Quality movement, first as a philosophy for production management, and later as a general approach for organizations. It would be a mistake to consider SPC as a technicality. As the founding father of Quality, Dr. Deming used to say, SPC is not simply a technique but a way of thinking.
Intelligent Management uses SPC to study and manage variation. It is a fundamental part of our Decalogue systemic management methodology.
If every process in our organization is affected, what kind of variation are we talking about?
There are two kinds of variation, one which we call intrinsic (controlled), due to normal causes that are permanent and do not change in time. The second kind of variation is uncontrolled, and is due to special causes that change in time.
The two types of variation are completely different, and must be dealt with differently.
Failing to identify the source of variation, special or common causes, leads to taking inappropriate actions on the system that may worsen the situation. Deming called that tampering with the system.
We use Statistical Process Control to distinguish between these two types of variation, and SPC provides us with an operational definition of how to obtain the maximum from our processes.
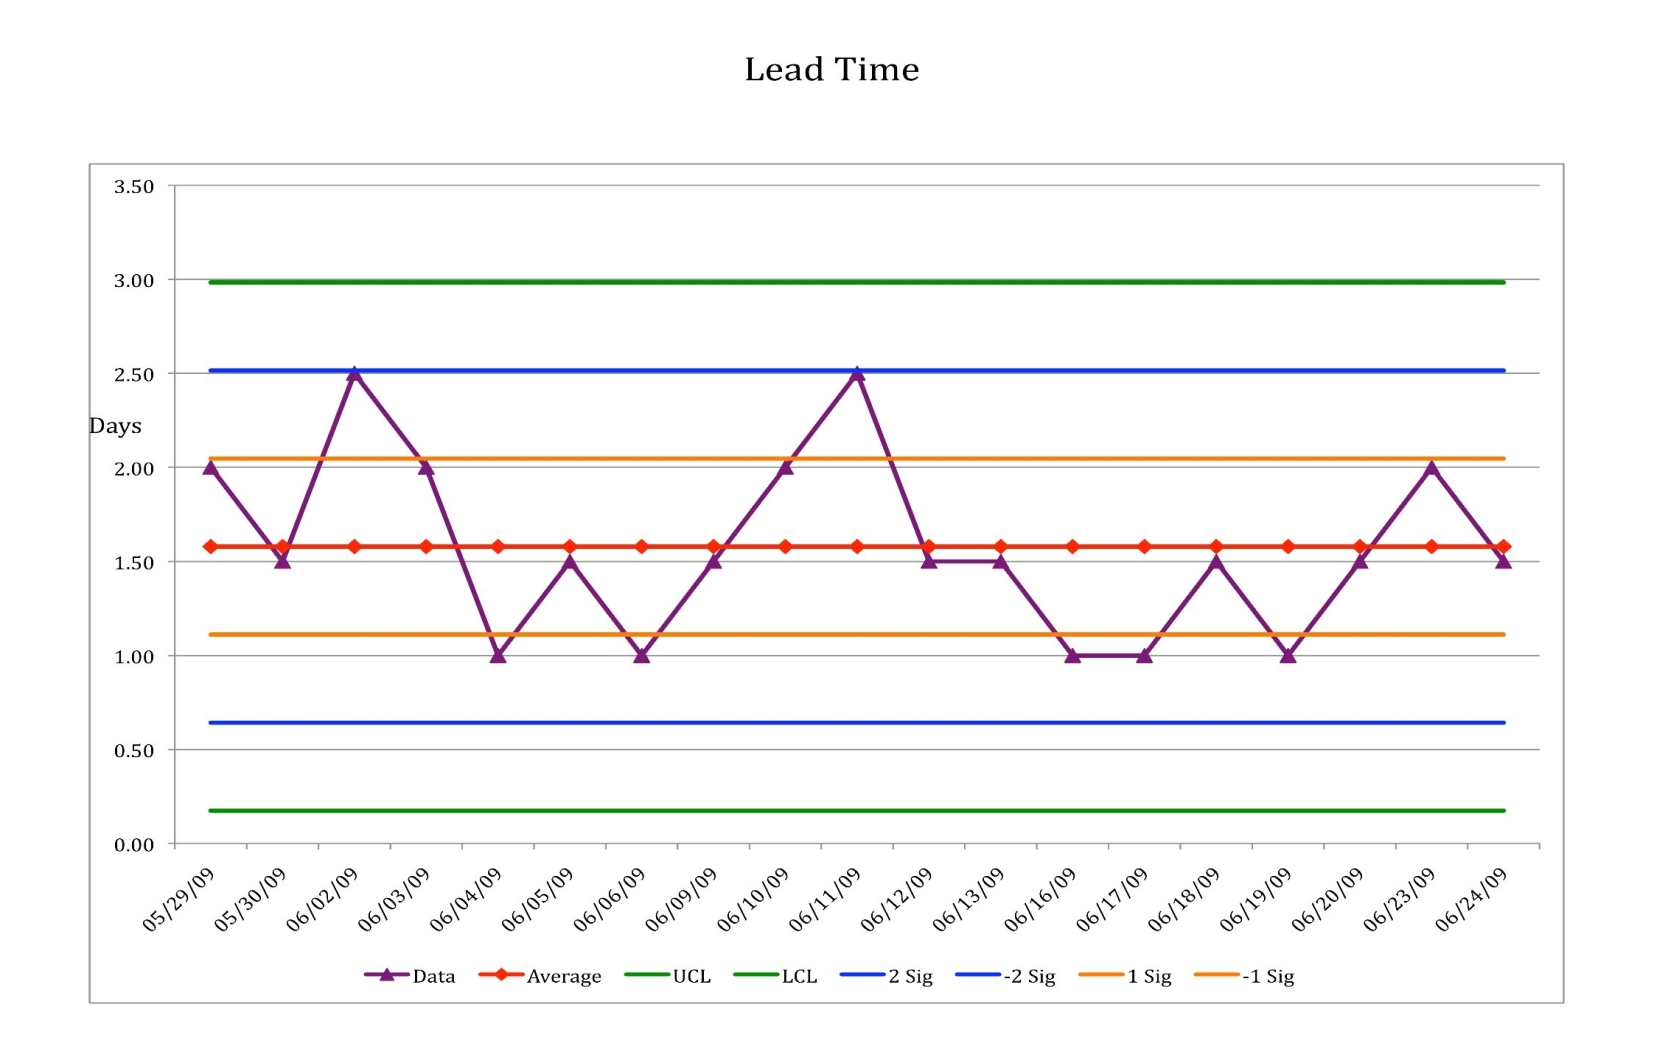
SPC uses what are known as “control charts”, or “process behaviour charts” to analyze variation.
A process behaviour chart is a time chart of a process (or the variables under consideration, e.g. the physical or chemical characteristics of a product) with three extra horizontal lines: the average value and the upper and lower limits of the process.
These limits are NOT specification limits. They indicate the intrinsic variation of the process. They are calculated using a statistical formula, using the actual data of the variables being studied. The meaning of these charts is not probabilistic but empirical and economic (W. Shewhart). The limits are fixed using the rule of 3sigma (sigma is the standard deviation, which measures the spread of the variable around its average value) i.e. they are placed at a distance of three “standard deviations” from the average value.
The reason for the choice of 3sigma is that 99% of 100% of data of a variable will be found at a distance of plus or minus 3 sigma from the average.
Once we have made a process behaviour chart, then how do we interpret it and use it?
When we have plotted the process, if the variable oscillates within the upper and lower limits, the process is said to be in control. If the oscillation goes beyond the limits, or if a series of points follows certain well-defined rules, the process is said to be out of control, or unstable.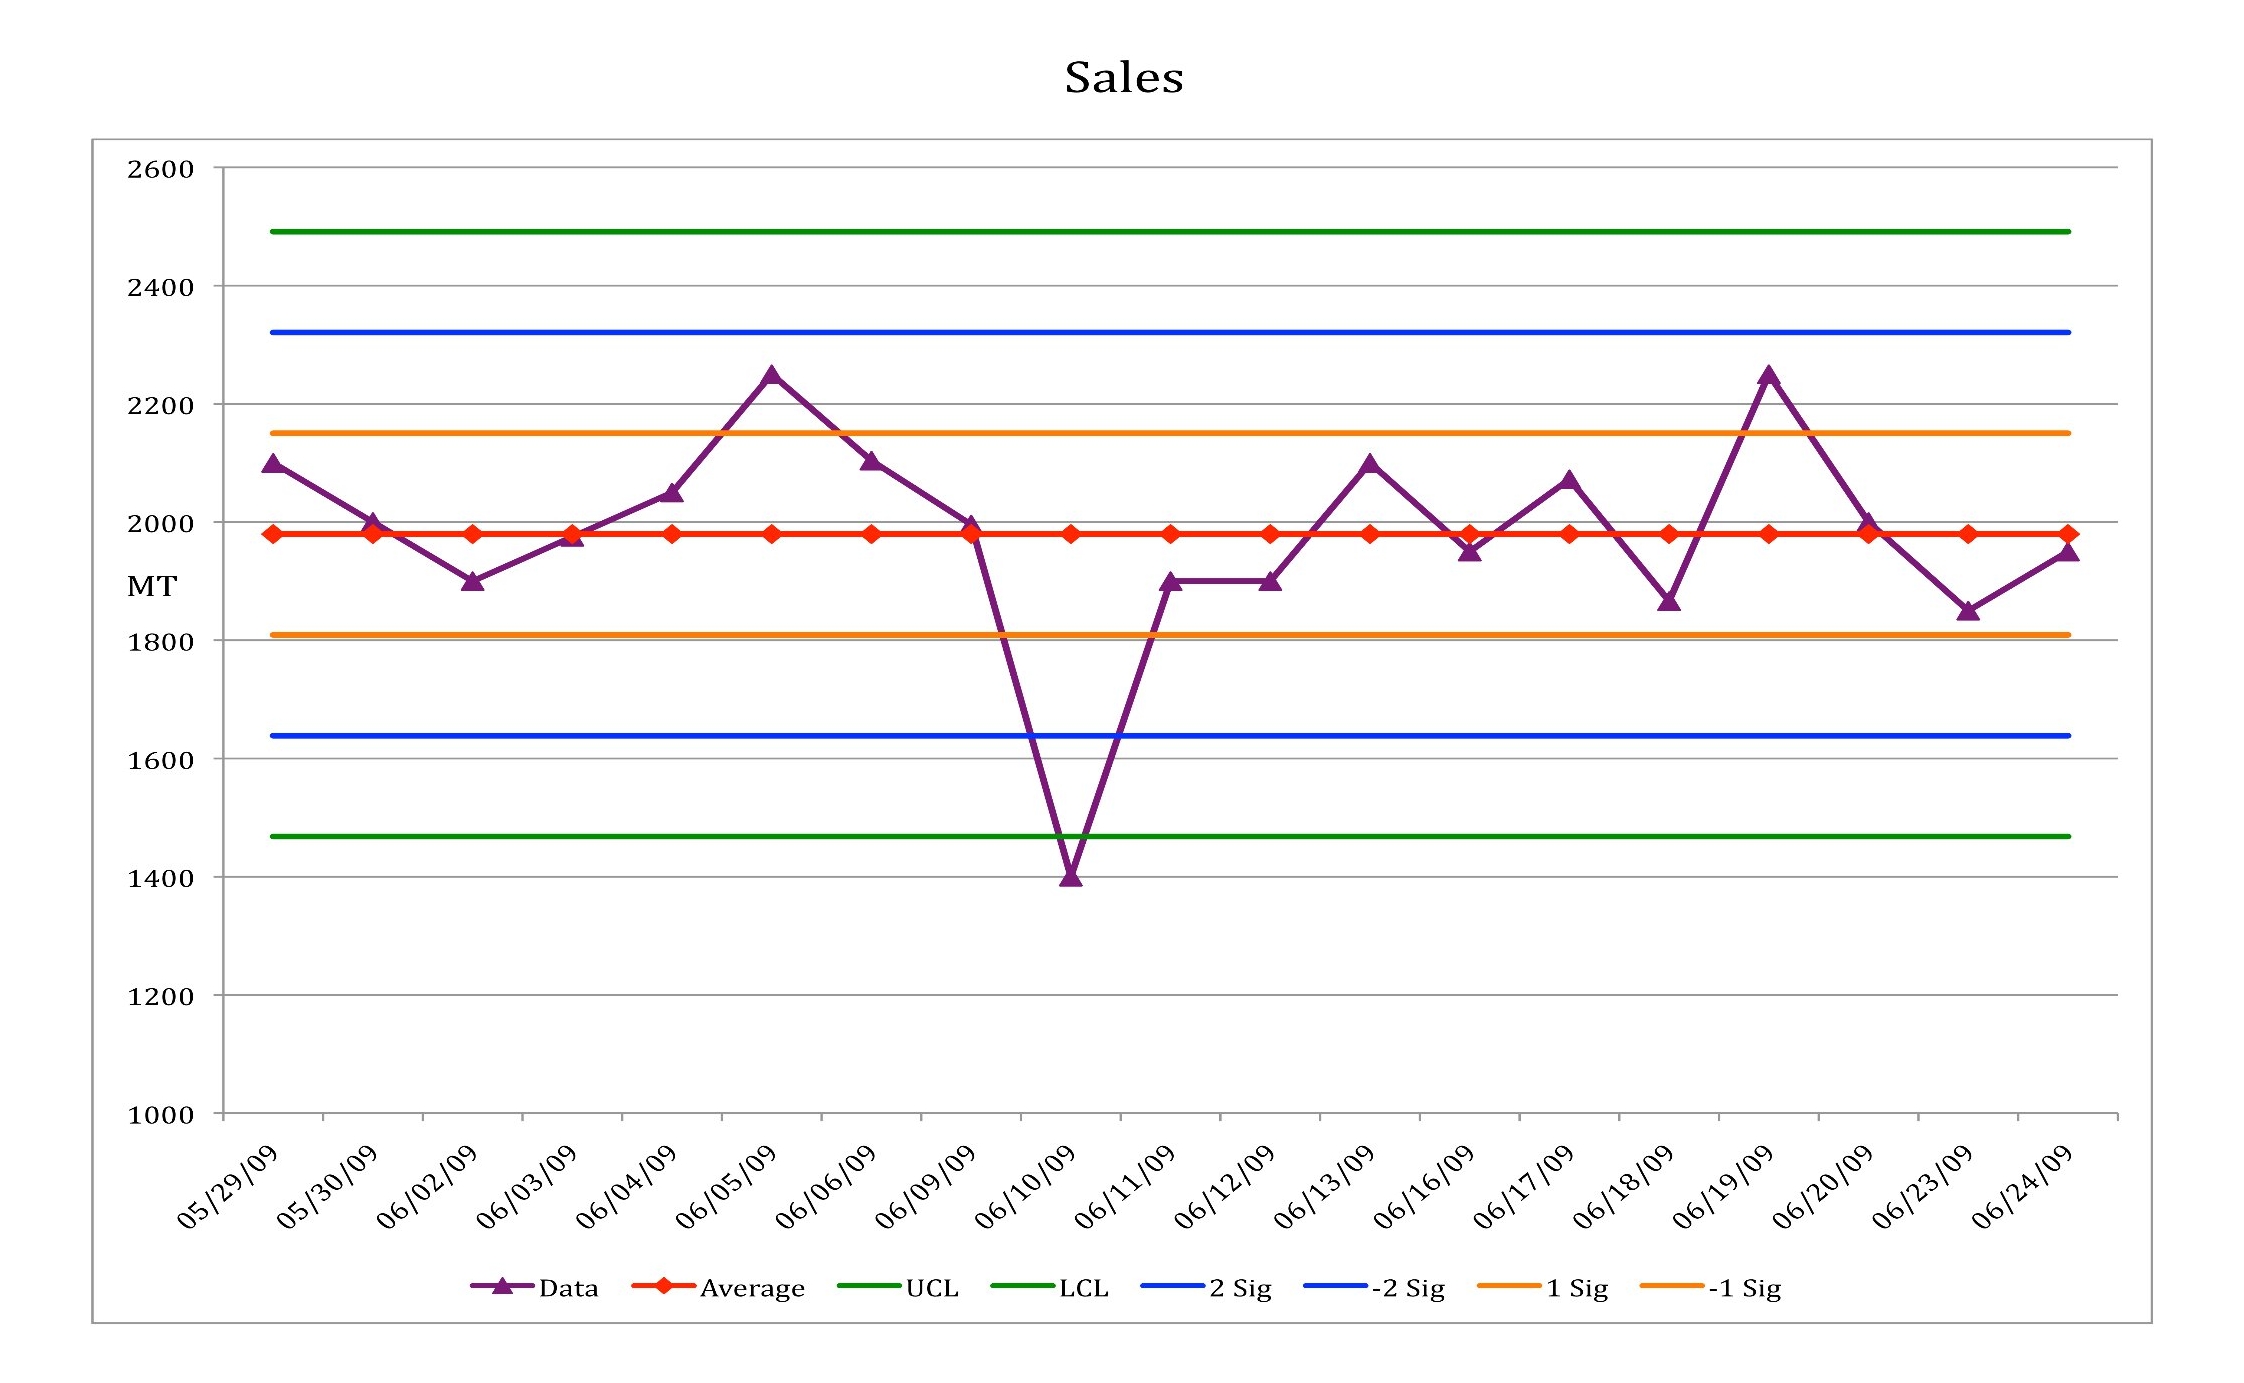
Out of control process
In control process
This distinction is of fundamental importance when we need to make decisions about improving the process, as the two causes of variation are fundamentally different.
In the case of normal causes, the process is stable and therefore we say that it is predictable. This means that on the basis of how the process behaves today, we can predict how it will behave tomorrow, i.e. always within the control limits. In the case of special causes, the process is unstable and therefore unpredictable. In other words, based on today’s behaviour, we are not able to predict anything about how the process will behave tomorrow.
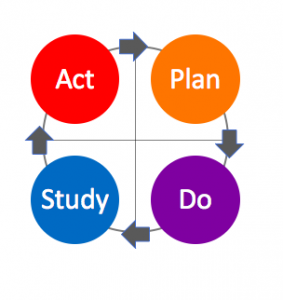
We certainly prefer to have a process that is in control rather than out of control as we can predict its behaviour, and that makes any planning simpler. Improving a process that is in control entails reducing its intrinsic variation, and this is difficult precisely because it is based on procedures that are consolidated and stable. This can be achieved by stratifying and dividing up into categories the factors that influence the process in order to analyze them, and by applying the Deming cycle (PDSA) in order to prepare experiments that will enable optimization.
Clearly, this is a complex procedure and, in some ways, disruptive as it introduces variation into the system, the effects of which we cannot know.
However, a stable process with high intrinsic variation is certainly not desirable, and we must make every effort to reduce that variation.
Paradoxically, a process that is out of control is easier to improve. We can detect a process that is out of control because there are points, or a series of points, on the control chart that lie outside the control limits, or that follow a precise patterns. In this case, it is easy to check the operational conditions related to those specific points, investigate the reasons for that behaviour and try to remove the special causes.
Process behaviour charts create an important distinction that helps us in the decision making process to understand when to act on the system and when not to act. It is a waste of time (and resources) to go and investigate a point on a control chart that “seems” too high or too low when a process is in control, i.e. predictable and affected only by normal causes of variation. Conversely, it is easier to establish where we need to act on a process if it displays special causes of variation.
The control limits are the “voice of the process”; they show us what we can achieve from a process, given the present conditions.
As we have already mentioned, this are NOT limits of specifications, which instead are the “voice of the customer”.
When we compare the limits of a process with specification limits, we can understand how many “out of specs” products the process in question will generate. If the specification limits are within the process limits, and the process is stable, then we will produce 100% of products to specification. If the specification limits are outside the limits of the process, and the process is stable, we will constantly and predictably produce a percentage of products that are not within specs. If the process is not stable, and the specification limits are within those of the process, then we are on the threshold of “chaos”, i.e. we get the impression that we are producing something to specification, but we will certainly begin producing products that are not within specs with no control over when or how.
Whenever the specification limits are outside of those of the process, then we are in a state of “chaos’.
Buffer Management
An important example of an application of SPC is what is called “buffer management”.
When we design our system so that is unbalanced around its constraint, in order to allow the system to work correctly we must protect it with a “buffer” (measured in units of time), that shows us how early we need material to be ready in front of the constraint.
How can we decide on the correct way to behave? If the buffer gets consumed, how do we resolve the conflict of “intervene vs. don’t intervene”? We solve this through the use of SPC (this is the injection to the conflict). Thanks to our use of statistical measurements of the buffer consumption we will have a precise indication. If the buffer consumption is “in control” we do not need to intervene. If, instead, the consumption is out of control, we must intervene immediately to eliminate the special causes of variation.
We apply the same concept to the consumption of a project buffer.
6 sigma: too much and not enough
Finally, a few comments to distinguish between the Intelligent Management approach and 6 sigma.
In the 6 sigma approach, a process that has specification limits outside of 6 sigma produces virtually “zero defects” (in itself a statistical hallucination), but no mention is made of whether a process is in or out of statistical control. Based on the assumption that in time any process changes its behaviour in respect with the short-term, an “empirical limit” of 1.5 sigma is introduced to keep account of this change. In other words, a process that contains, in the short term, the interval of plus or minus 6 sigma within the specification limits, in the long term will only have an interval of plus or minus 4.5 sigma.
This assumption “eliminates” the problem of non-predictability, using the interval of 1.5 sigma as a buffer. The assumption made by the 6 sigma approach is that, after a while, all processes operate within this interval.
Shewart has demonstrated that this does not happen. Predictability is a goal, and consistency and predictability are not natural states.
The solution to the problem of producing products that are “within specs” is continuous improvement achieved through using the PDSA cycle, supported by a statistical understanding of variation.