
We continue our series focusing on what companies need to embrace today to succeed and scale up because what may have worked before is inadequate for the complexity all organizations face today. The series is based on our new book From Silos to Network: A New Kind of Science for Management’ to be published by Springer this September!’
What is Variation?
In the real world no recurrent events repeat themselves in an identical manner. The outcome of every measurable (repetitive) process will invariably yield different results, measurement after measurement (provided that the measuring tool is sufficiently sensitive). This applies to journey time from the same two locations, daily production output, daily oscillation in body weight, etc. Variation exists.
In his ground breaking book ‘Economic Control of Quality of Manufactured Product’, Dr. Walter Shewhart laid the foundation for understanding Variation. One of his main findings is that there are two kinds of variation (our wording):
- Variation due to causes intrinsic to the process/system that generates them. They are inherent in the way the process is built and they will always be present. They are called common causes of variation (or intrinsic causes).
- Variation due to external, assignable, causes that are not an inherent part of the way the process is built. They are called special causes of variation (or assignable causes).
It is essential to recognize and understand the difference.
Common causes generate over time a pattern that is statistically predictable; we can somehow tell how the process will behave in the future by looking at how it has behaved in the past.
Special causes, on the contrary, generate a pattern that is statistically unpredictable; the past behaviour of the process will tell us nothing about its future.
If we want to design organizations as Systems it becomes then imperative to understand what kind of variation our processes are affected by as our managerial decisions should be informed by it. Accordingly, how can we distinguish special causes of variation from common causes of variation?
Process Behaviour Charts
Process Behaviour Charts (or Process Control Charts) are used to unveil the nature of a process, i.e. whether it is statistically predictable (we can predict its future behaviour from its past) or statistically unpredictable (we can say nothing about what is going to happen going forward).
We need the charts to avoid unnecessary, undesirable and often fallacious interference that may (and usually will) occur when managing a process, e.g. operators trying to keep the process “on target”, rewarding or blaming individuals for sales performances, variance in Budget Vs. actual analysis, etc.
Dr. Deming built upon this body of knowledge to formulate his systemic management philosophy and the “New Economics” that goes with it.
When we analyze a process and its variation, we deal with a set of data collected from a measurement. In order to understand the behaviour of the process, the first step we need to take is to understand the oscillation of the data around its average value.
The elements that form a Process Behaviour Chart are the set of data and three lines:
- The Average of the process;
- The Upper Natural Limit of Oscillation (Upper Control Limit)
- The Lower Natural Limit of Oscillation (Lower Control Limit)
These Limits ARE NOT IMPOSED SPECIFICATION LIMITS. They represent the inherent, “natural” variation present in the data.
In formula form:
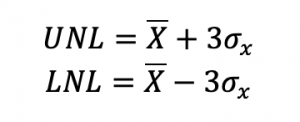
Where is the standard deviation of the given data distribution. In essence, it is a measure of how the data are dispersed (distributed) around an average value.
The choice of ±3s for the upper and lower limits was chosen by Dr. Walter Shewhart based on economical and empirical considerations, not statistical ones. This is because the body of knowledge he developed while working at Bell Laboratories was aimed at solving an industrial problem; the monumentality of Shewhart’s contribution lies in tackling a practical engineering issue with a scientific, epistemological, somewhat abstract, approach. In the 1920s, Shewhart laid the mathematical foundation for the management of Quality that Deming would go on to develop over the ensuing six decades.
Examples of Process Behaviour Charts
Let’s give another blow to our conventional, linear thinking and look at two examples.
EXAMPLE ONE: A production process.
The following two charts represent the same process with different output.
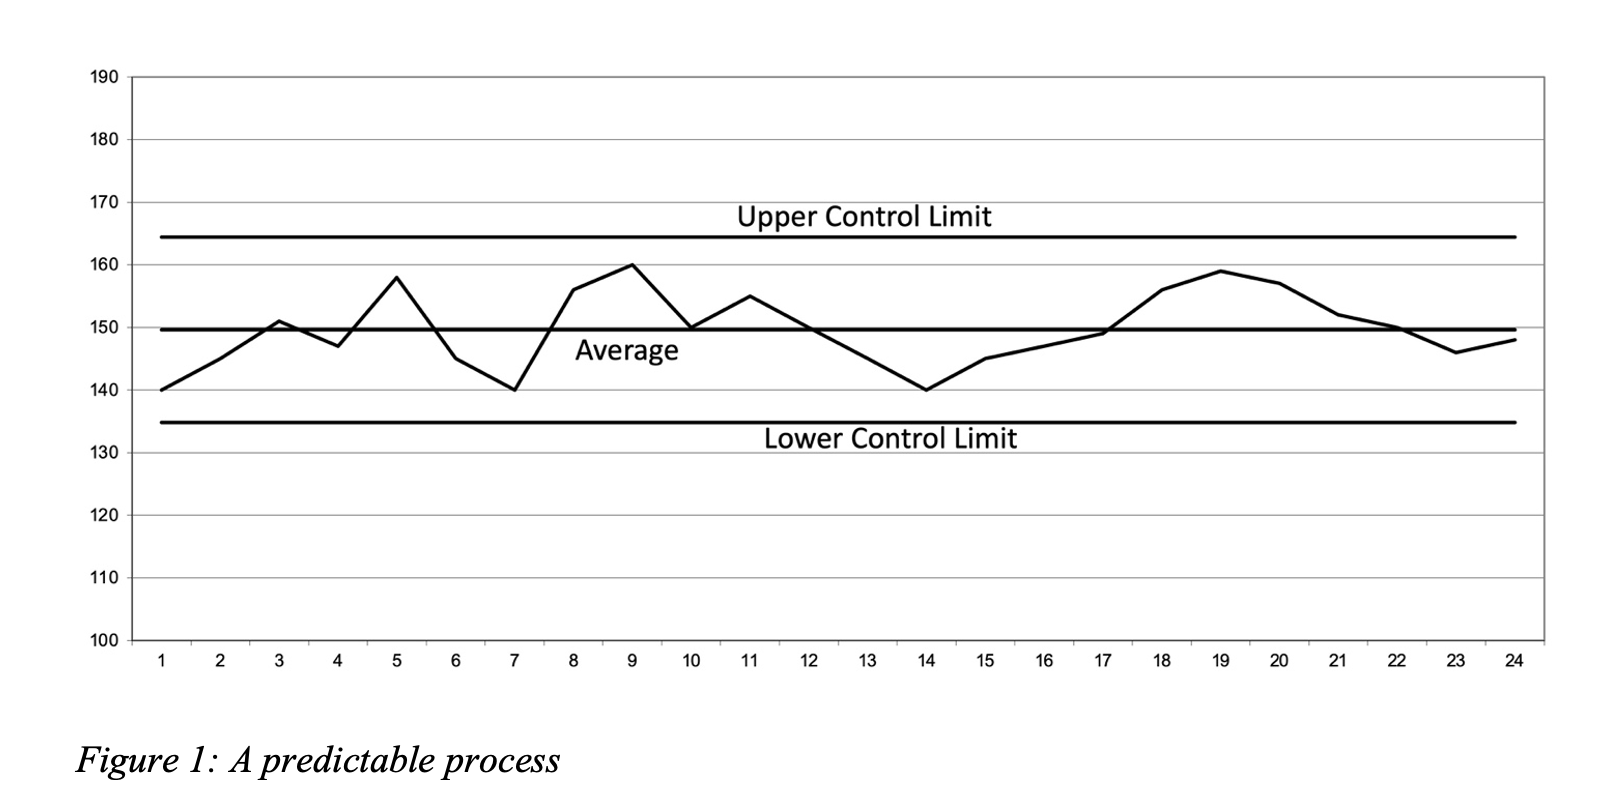
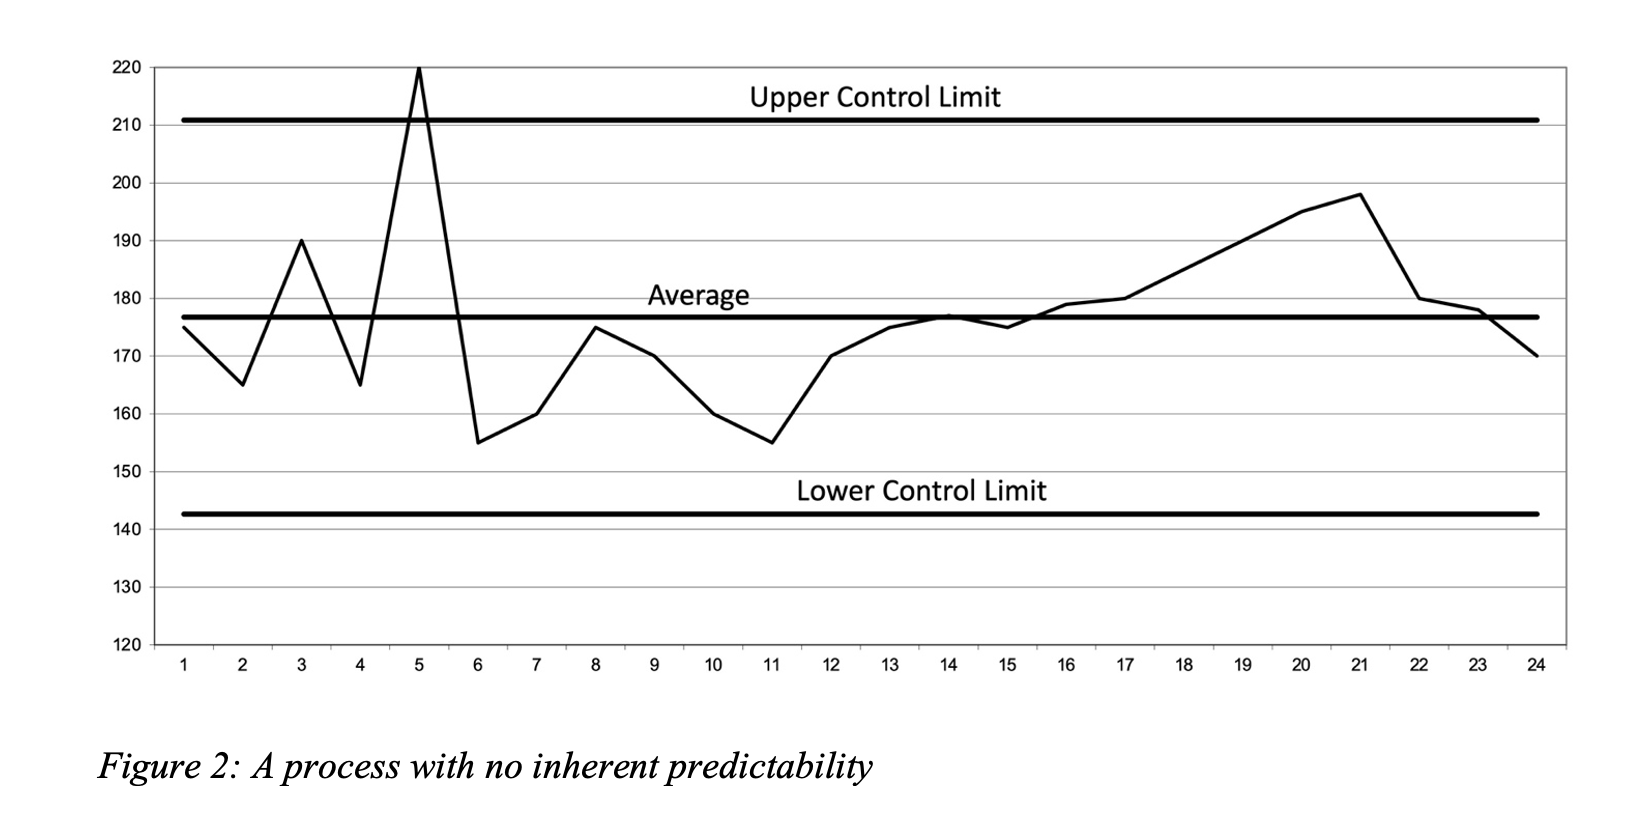 In the former, the process has an average of 150 and oscillates between 135 and 165. In the latter, the process has an average of 178 and oscillates between 143 and 210.
While the average value of the latter might be, in principle, more desirable (higher average output value), the range of oscillation (variation) is much wider than the former (30 against 67) and we can immediately identify one point in the second chart that is beyond the upper limit of variation, there is no inherent predictability in this process – anything could happen tomorrow.
Let’s keep in mind that the UCL (Upper Control Limit) and the LCL (Lower Control Limit) are calculated, just as the average is. They are not specifications, and do not represent the maximum and the minimum of the data series. They represent the voice of the process, i.e. the natural (intrinsic) variation of the process.
What we can say about these two processes is that the former exhibits some level of consistency over time and we can say something about its future; about the latter there is nothing we can say, whether its outcome is desirable or not.
EXAMPLE TWO: Arrival time at work
The following two charts represent the arrival time at work for two different workers (who are supposed to clock in at 8am).
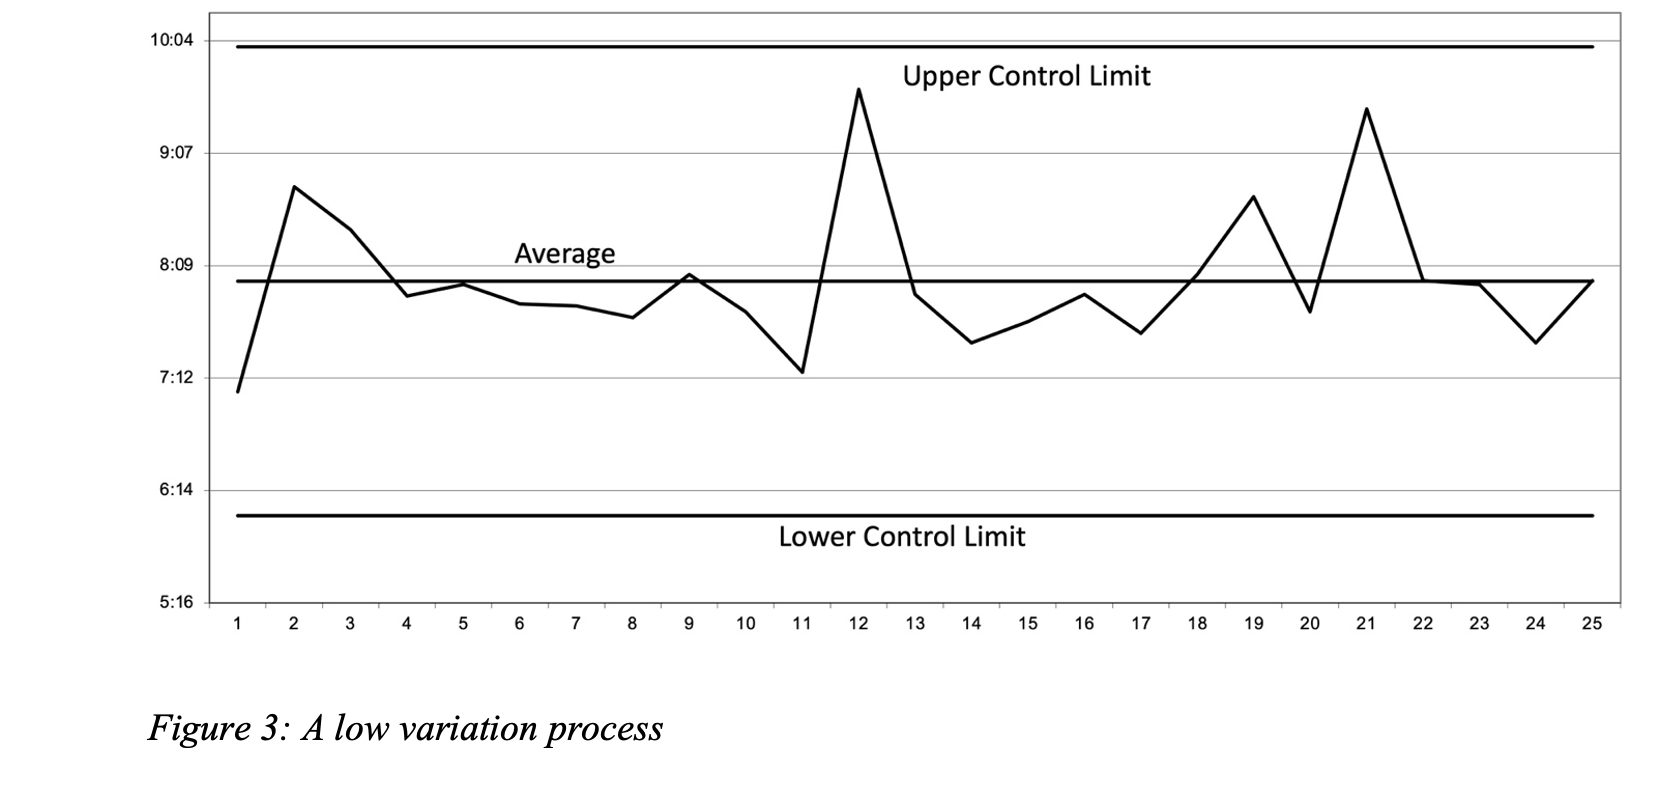
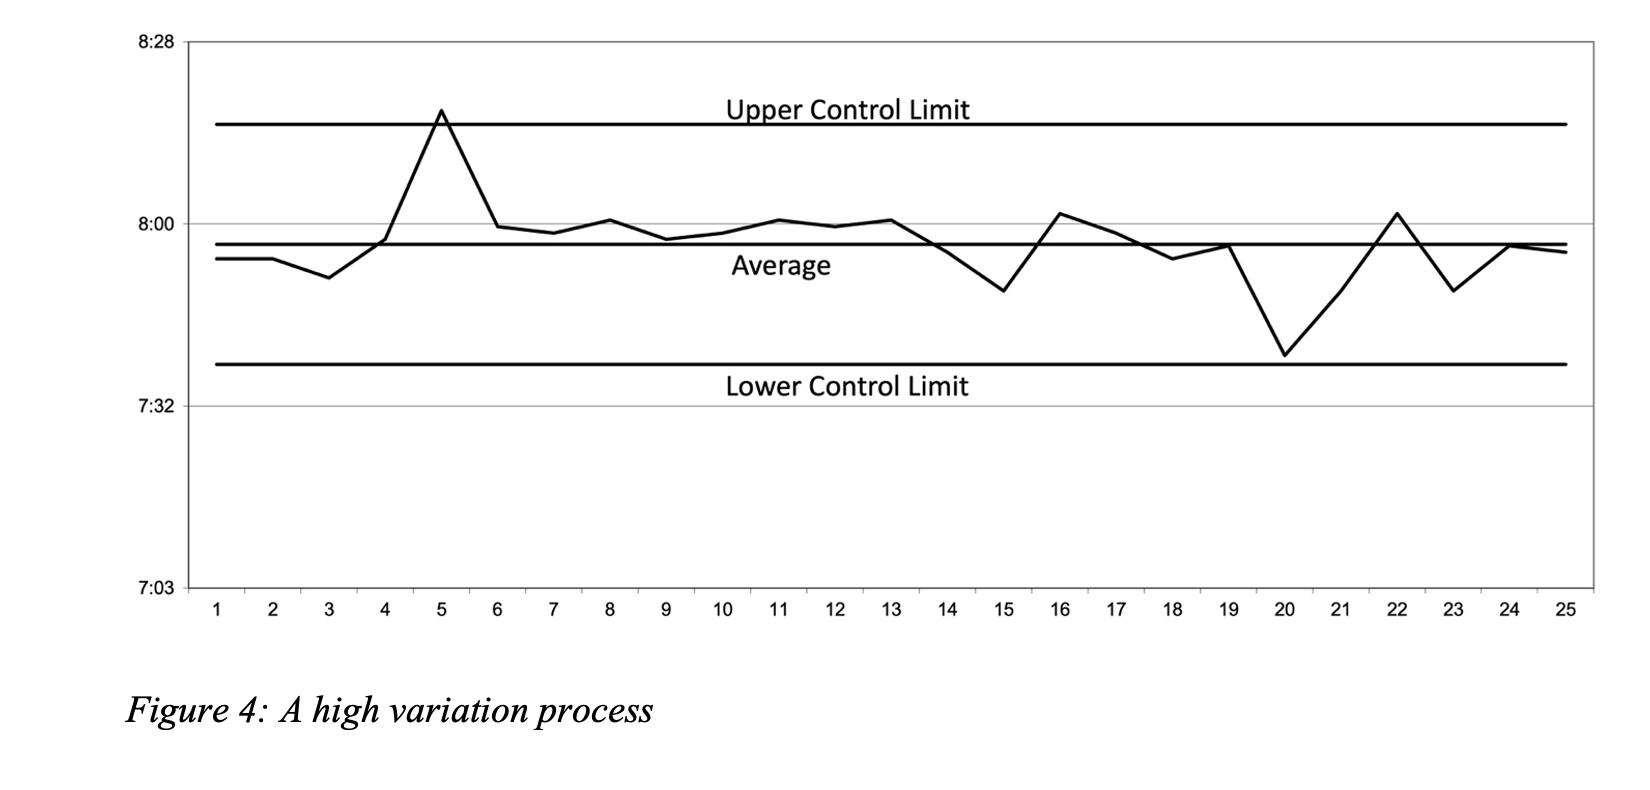
The first worker shows an average arrival time of 8:01, and the oscillation is between 6:15 and 9:48 (pretty bad, one may say).
The second worker shows an average arrival time of 7:57, and the oscillation is between 7:38 and 8:15 (pretty good, one may say).
Again, we can immediately identify one point beyond the upper limit of variation in the process for the second worker. We cannot say anything about what his/her next arrival time will be.
In the first example we have:
Case 1 – low variation and process oscillation within its natural limits (in statistical control)
Case 2 – high variation and process out of statistical control (one point beyond the UCL).
In the second example we have:
Case 1 – high variation and process oscillation within the limits (in statistical control)
Case 2 – low variation and process out of statistical control (one point beyond the UCL).
The lesson is: a wide range of variation does not imply that a process is necessarily unpredictable (“out of statistical control”). Similarly, a narrow range of variation does not imply that a process is predictable (“in statistical control”) Very different managerial decisions must be taken to address these four situations and we highly recommend undertaking further studies as the success of a synchronized Network of Projects will heavily rely on these decisions.
All of the above is, evidently, counterintuitive and it does require some sort of “re-wiring” of our thought process. This is why we need these charts. Simply speaking, the human mind struggles with statistical thinking.
In short: relying solely on intuition (e.g., high variation means unpredictability and vice versa) to make decisions is misleading. Actions following only intuition in a complex environment lead us to wrong decision-making triggered by both ignorance and the ever present cognitive constraints (cognitive biases).
To find out more about ten guided steps to a systemic leap ahead for your company, contact Angela Montgomery at intelligentmanagement@sechel.ws
SCHEDULE AN INTRODUCTORY CALL WITH US
Intelligent Management works with decision makers with the authority and responsibility to make meaningful change. We have helped dozens of organizations to adopt a systemic approach to manage complexity and radically improve performance and growth for 25 years through our Decalogue management methodology. The Network of Projects organization design we developed is supported by our Ess3ntial software for multi-project finite scheduling based on the Critical Chain algorithm.
See our latest books Moving the Chains: An Operational Solution for Embracing Complexity in the Digital Age by our Founder Dr. Domenico Lepore, The Human Constraint – a digital business novel that has sold in 43 countries so far by Dr. Angela Montgomery and ‘Quality, Involvement, Flow: The Systemic Organization’ from CRC Press, New York by Dr. Domenico Lepore, Dr. .Angela Montgomery and Dr. Giovanni Siepe.



Leave a Reply