 How do we know what we are doing?
As Dr. Deming used to say, “if you cannot describe what you are doing as a process, you don’t know what you are doing”.
Each and every part of an organization, be it a person, a machine or even a project or process, has a role in the System. Highlighting these roles, how they interdepend and the flow of activities they are part of is the starting point to make sure, as Dr. Deming recommends, that we know “what we are doing”.
Every company has a certain number of activities that it must carry out in order to deliver what it sells, whether that is a product or a service, to a customer.
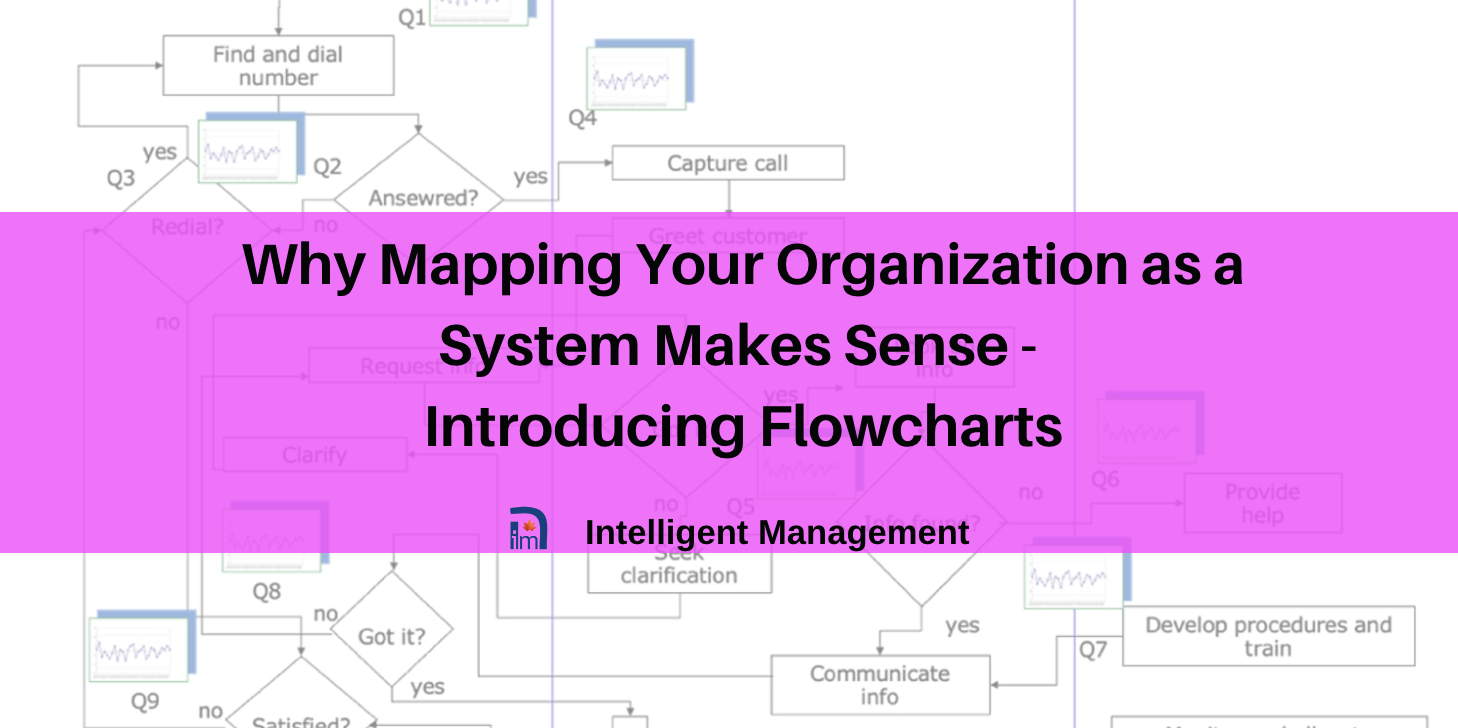
Mapping out all the interdependencies/linkages that exist requires us to understand the company’s processes and how to link them together. This can be done simply and effectively by using flowcharts to map out every process in the organization, identifying who does what and in what sequence. A flowchart will show the interactions among people in the various phases of the process. It is crucial to know what these interactions are to really understand how the process works and how to improve it.
Transforming inputs to outputs
A flowchart provides a map (or a chain, if you will) of tasks and decisions. It describes the flow of materials, information, and documentation. Ultimately, the main purpose of flowcharting is to show the way the System transforms inputs into outputs. Drawing a flowchart immediately draws attention to the fact that most process chains must cross functional boundaries in order to deliver a product or service to the customer. Flowcharting encourages everybody to describe “how it should be done” and this can only be effective in an environment that is free from finger-pointing and open to change.
This is a first (and crucial) step in understanding that the conventional, functional pyramid (organization chart) that is still today the way so many organizations think of themselves is a self-imposed limitation (an artificial constraint) to the development of a truly Systemic Organization.
Spotting unnecessary loops
Flowcharting processes to show how they should ideally happen is a very revealing activity. It immediately becomes obvious that the existing processes contain unnecessary, often obsolete, loops. These may well have been brought about by the need to create a workaround solution (probably triggered by some emergency) that has then become accepted as common practice. The flowcharting will also show any misalignments that exist between employees’ authority and responsibility that prevent them from taking necessary actions autonomously and it will bring to light problems and/or breakdowns in the customer-supplier chain that were previously unclear.
Simply put, flowcharting helps us overcome blockages and barriers that prevent the processes from running smoothly and effectively. Moreover, flowcharts help to identify “Key Quality Characteristics” (KQC), i.e. those aspects of a process that strongly affect the ability of that process to achieve the goal for which it was designed (and have a major impact on the performance of the organization as a whole.) We can then use these KQC as points in the process to collect meaningful data to monitor variation. This will inform us:
- whether or not the process is in a state of statistical control before we attempt to improve it;
- whether or not attempts to improve the process are succeeding.
Deployment flowcharts
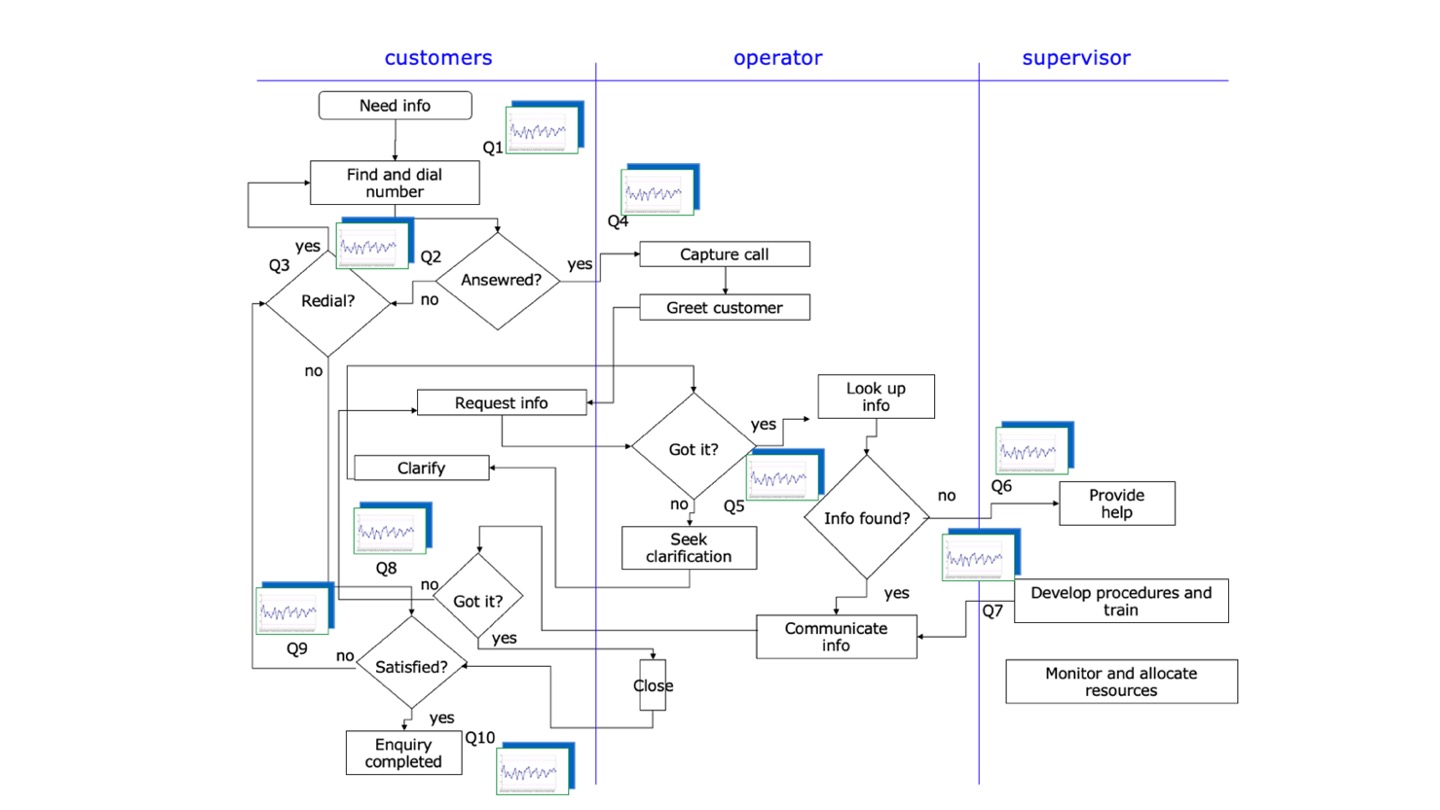
Let’s look at a particular kind of flowchart called a deployment flowchart (DFC). A DFC shows the interactions among people that take place along the various stages of the process as well as who does what. It is crucial to know what these interactions are to really understand how the process operates and how to improve it.
The operational steps to draw a DFC are:
- Define the process boundaries: where will it start and finish?
- Identify the key areas of the process (the main competencies required). To help people focus and describe their interactions accurately, we can ask questions such as: What are the inputs to your task that are relevant to the process under discussion? Where does each input come from? What is the expected output? Who is the recipient of the output?
- Identify the main roles/competencies required and list them at the top of the flowchart. When the flow moves from one competency to another this is represented by a horizontal line. (Placing the main roles at the center of the page will help reduce oscillation across the flowchart. Otherwise, we should put the main competency involved earlier in the process to the left, and those involved later to the right.)
The following figure is an example of a deployment flowchart including KQC. The small charts placed at the KQC points are Process Behaviour Charts. The purpose of these charts is to monitor the variation of processes at those chosen points to learn about the nature of variation affecting them. This knowledge enables us to take rational decisions regarding improvement of the process.
Simply by flowcharting the activities in your company, you can take a major step ahead in improving overall performance and understanding how everything is interconnected to overcome silos.
To find out more about ten guided steps to a systemic leap ahead for your company, contact Angela Montgomery at intelligentmanagement@sechel.ws
SCHEDULE AN INTRODUCTORY CALL WITH US
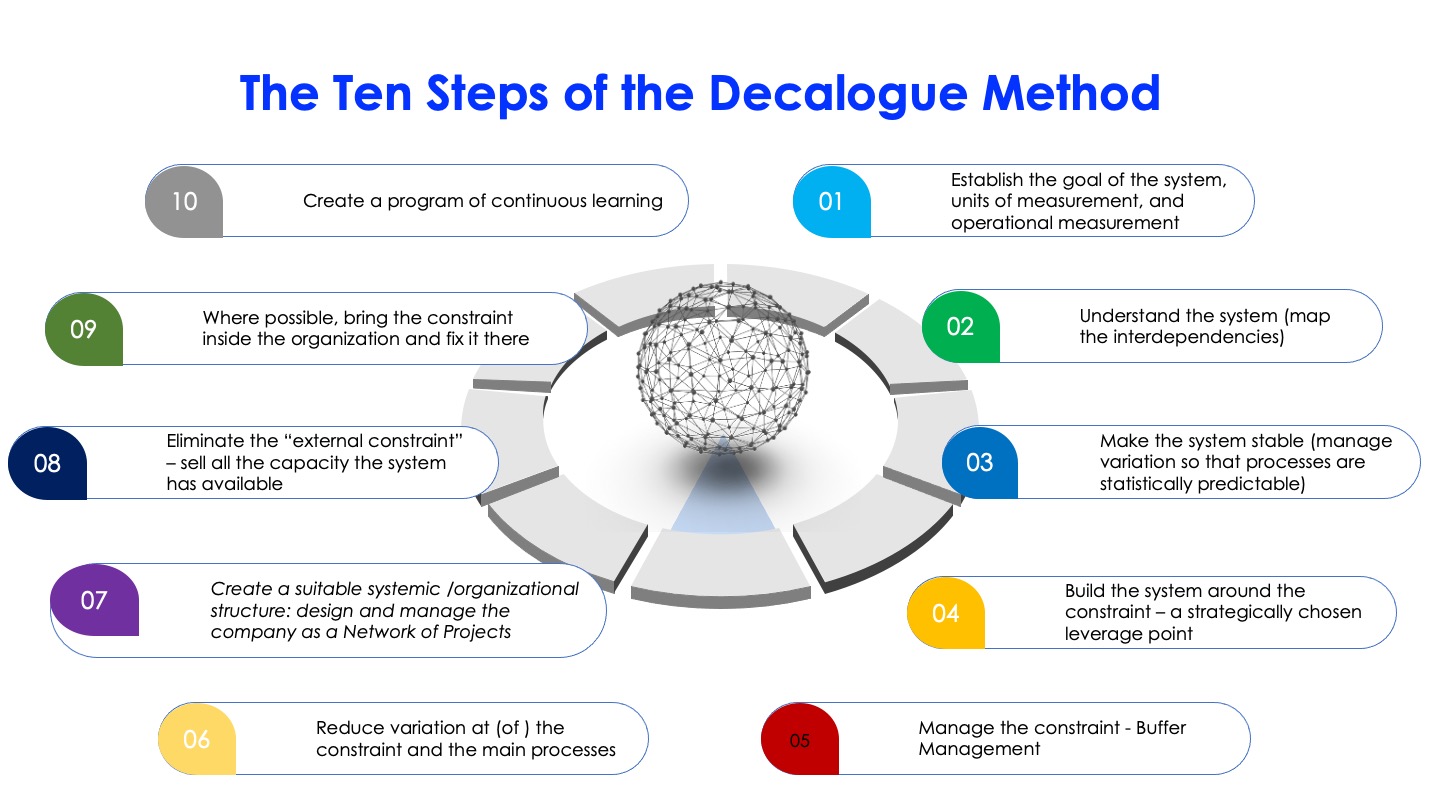
Intelligent Management works with decision makers with the authority and responsibility to make meaningful change. We have helped dozens of organizations to adopt a systemic approach to manage complexity and radically improve performance and growth for 25 years through our Decalogue management methodology. The Network of Projects organization design we developed is supported by our Ess3ntial software for multi-project finite scheduling based on the Critical Chain algorithm.
See our latest books Moving the Chains: An Operational Solution for Embracing Complexity in the Digital Age by our Founder Dr. Domenico Lepore, The Human Constraint – a digital business novel that has sold in 43 countries so far by Dr. Angela Montgomery and ‘Quality, Involvement, Flow: The Systemic Organization’ from CRC Press, New York by Dr. Domenico Lepore, Dr. .Angela Montgomery and Dr. Giovanni Siepe.


This reminds me a little of value Stream Mapping and I am curious to understand why you chose flowcharts over VSM – a flow chart has specific symbols and feels more restrictive than a value stream map. Your thoughts?
Value stream map has two purposes: reduce “waste” and show steps that “add value” to the product(s) (LEAN approach).
1) Mapping processes focuses on interdependencies: how the parts of the system work together towards the goal; mapping processes is not meant for local optimization. We map processes to improve the whole system (Deming dixit). What is more, though waste is bad, TOC focuses on THROUGHPUT generation and not on cost reduction.
2) In the TOC/Decalogue approach, the “value” of a semi-finished product (associated to a step of the process…) is just the value of the raw material (or the service that we might purchase) used to produce the item.