 Now that we know how to measure what matters (see How to Make the Best Decisions for Your Company and Measure What Matters – A Systemic Approach to Management Part 3 ) we can focus on really understanding the interactions in our organization/system. Step Two of the Decalogue Method is Understand the system (draw the interdependencies).
If we do not know who does what, what the inputs and outputs are, and how everybody’s work is connected, then we are not managing. As Dr. Deming used to say, “Business schools teach you how to raid a company not how to manage it.” It is disconcerting to discover how little we know about our system until we have a clear picture of how our interdependencies are laid out and how often top management neglects this issue. (Paradoxically, in some companies Quality and Continuous Improvement have become silos). Through mapping out all the main processes of an organization, Step Two provides the foundational elements of understanding that will enable us to build truly effective Quality in our system through healthy interactions.
What do we mean by healthy? Let’s go back to the definition of a system that we gave earlier:
“a network of interdependent components that work together in order to achieve the goal of the system.”
If we want to reach our goal (see Step One of the Decalogue), we must be sure that the components of our organization behave consistently with respect to the goals we have established. In order to do this we must be capable of thoroughly understanding how these elements in our system interact. This means that we must be able to see our organization as a network of interdependent processes (its components); indeed, we must understand how our system works.
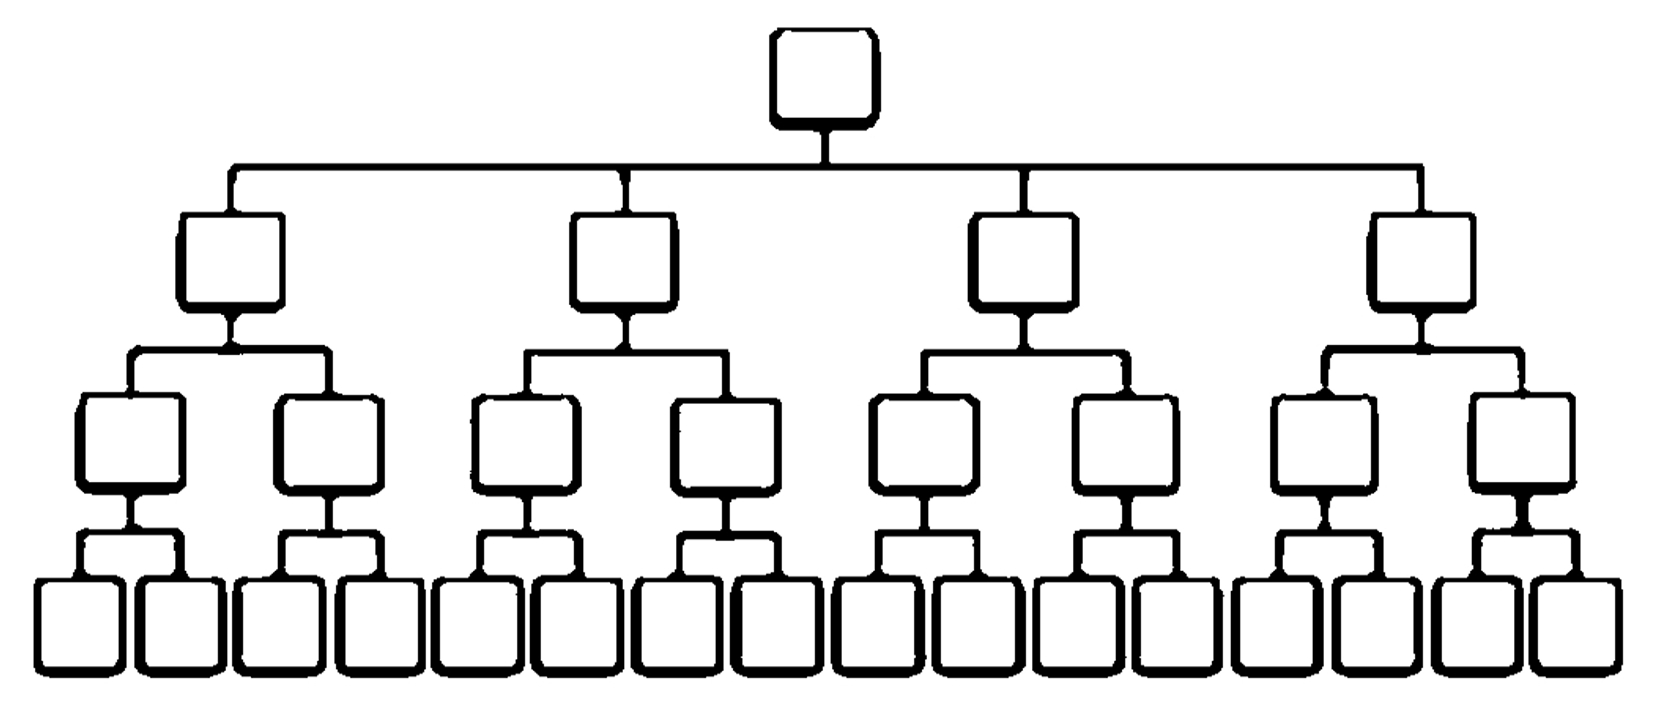
Which tools can supply us with this type of vision? Let’s examine the traditional way in which a company is represented by looking at this diagram.

Does this type of hierarchical representation allow us to understand the way our organization works? If we try and understand where the interactions are among the various components, we are unable to come up with a reply. Every company function seems to operate in perfect isolation. The model we use to draw our organization is strictly linked to the way we manage.
The idea (paradigm) which lies at the base of this hierarchical model is that the aim of a company is achieved via the sum of the efforts of single individuals or departments; each one carries out tasks separately and independently from the others, and the total sum of the individual performances is equal to the performance of the company. This is a linear view.
In the systemic view, however, the company goal is achieved thanks to the interaction of individual efforts.
Just think what would happen, for example, if we decided to buy material at the lowest price, or to increase sales, or to spend less on designing or developing products without considering the effects that these kinds of actions might have on the rest of the system and therefore on overall performance.
What we need to concern ourselves with is how to integrate these efforts in order to achieve the goal we have established.
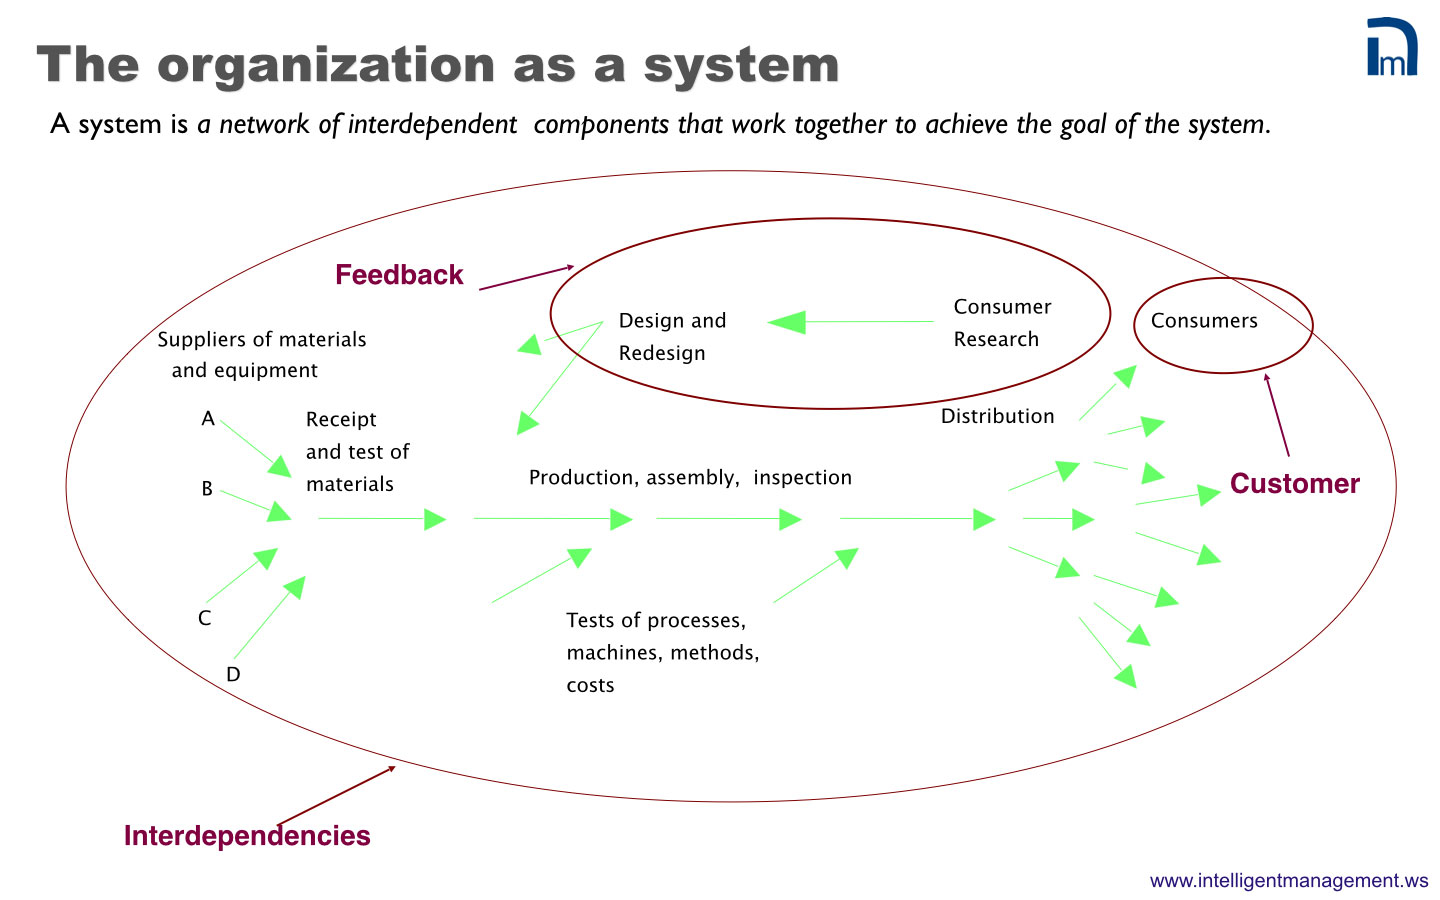
In the hierarchical structure: the “customer” of a particular function is the function above it, the one that controls the work carried out. But in order to see the interaction among the various parts of the system, the customer, who we must absolutely include in the picture, is none other than the component that receives the output of that particular function, what we call the “internal customer”. This interaction is made clear in a diagram Dr. Deming used in all his lessons since 1950 – Production Viewed as a System. Here is our rendering of that diagram:

This way of representing reality shows people what their job is, and indicates how they have to interact with the other components of the system. By looking at this kind of representation, every person in the organization can understand what tasks they have to perform and how they have to cooperate with others. Now we can see the interactions among the various components of the system, including two essential elements that do not appear in the hierarchical diagram: the suppliers and the external customer.
This way of representing the company allows us to go a step deeper and realize that an organization is an open system, in constant interaction with its surrounding environment. This environment, as well as our organization, in turn consists of a series of interdependent processes that are in constant interaction. If we want to understand more about the interactions, we must design the main processes that constitute our system.
What is a process?
It is very important for us to have very clear definitions of the concepts we use. So we must define as fully as possible what we mean by process. Let’s define a process as a set of steps which, when carried out in a given order, produce a change. Each process is made up of a set of inputs and a set of outputs.
 Some of the inputs come from components of the system that actively contribute to the change. Another kind of input is the material itself that the process is acting upon. In other words, what is being changed.
If we want to design the processes in our organization, we have to consult all the people involved. By asking people for their help in this, we are allowing the process to be designed by those who actually do the work – the suppliers of the process (the “active input”), their customers and also those who control the process.
Processes, collaboration and Deployment Flowcharts
When we design our processes by consulting all those involved, we are able to represent both the positive and negative aspects of what really happens in our organization. The representation of the process should tell us:
- Who does what
- What gets done
- Which decisions have to be made
- What are the possible consequences of every decision
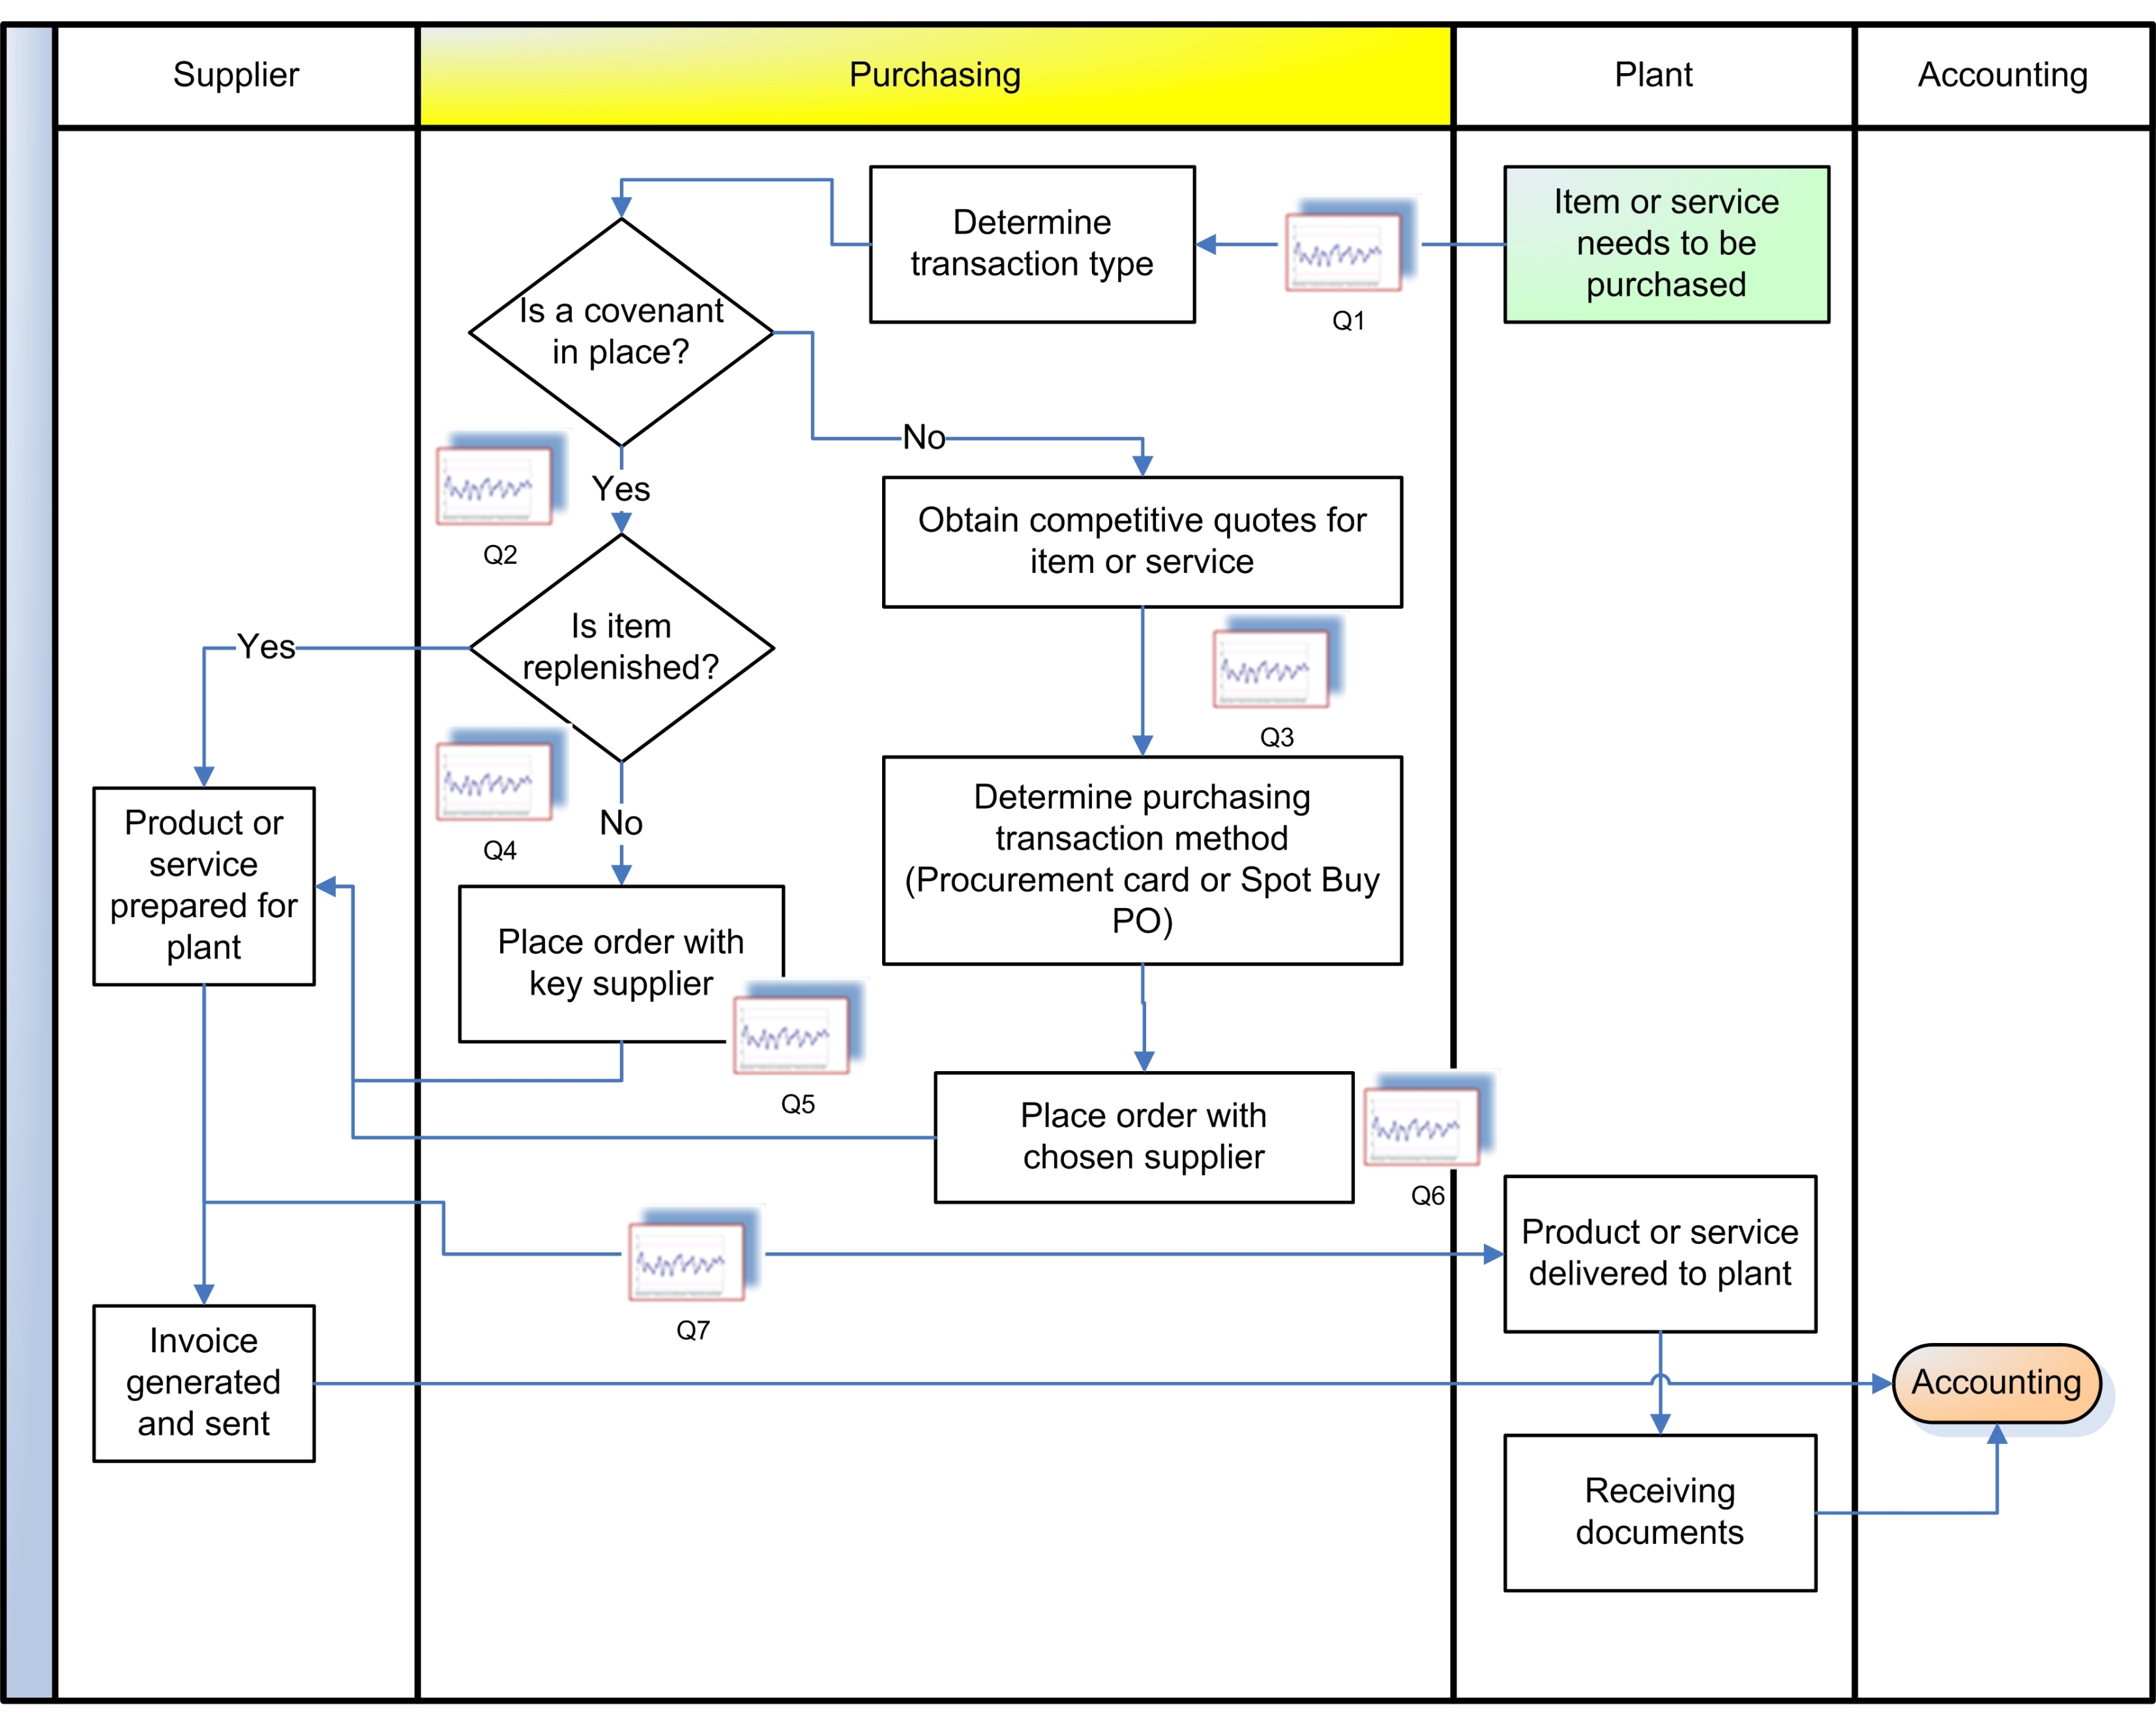
A Deployment flowchart (DFC) describes who does what. It shows the interactions among people in the various phases of the process. It is crucial to know what these interactions are to really understand how the process works and how to improve it.
The steps for drawing a DFC are the following:
- Identify the boundaries of the process, go through the process following the sequence of events, and achieve an overall vision without too many details
- Identify the key areas (competencies)
- Arrange all the stages of the process on a flowchart by competency, according to the sequence in which they are carried out, including all the feedback loops that the conversations entail
When we map out the organization as a system in this way, functional roles disappear and what emerges is a network of conversations that need to take place on a regular basis to make the linkages work toward the goal. This map of processes is not static; it develops over time with the life of the organization.
Once we have gained a clear picture of the organization through the mapping process, we identify what we call “key quality characteristics.” These are special places inside the organization that we understand have a major impact on the performance of the organization as a whole. Once identified, these characteristics become the key points for where we plan to continuously monitor variation and thus work toward its reduction (if and when possible or appropriate). These actions are the prerequisites for managing variation with statistical methods for continuous improvement. With these two aspects alone, mapping out and managing processes and the variation that affects them, we have the fundamental means for fostering quality and flow across an entire organization.

The Deming revolution
Deming was able to provide a quite revolutionary view of an organization as a system in his diagram from the 1950s that we included earlier. It is a complete shift away from a traditional, hierarchical view of an organization. There are no vertical “lines” to be managed, simply a flow of inputs that are transformed into outputs. The modernity and the revolutionary character of Dr. Deming’s view are even more evident today, a moment in time when network theory is beginning to clarify the implications of the exponential growth of the interconnectedness of the world we live in.
Try it for yourself
What are the main processes in your company? Which competencies are required to carry them out? Map out these processes using a Deployment Flowchart. You will not only have an accurate map of your system but also immediate evidence of where improvements can be made to increase the Quality you produce, the involvement of your people and the speed of flow of all your interactions.
See Part 5 of this series Leadership for Complex Times
PREVIOUS POSTS IN THIS SERIES:
Radically Improving Organizational Performance – A Systemic Approach to Management Part 1
To find out more about ten guided steps to a systemic leap for your company, contact Angela Montgomery at intelligentmanagement@sechel.ws
SCHEDULE AN INTRODUCTORY CALL WITH US
Intelligent Management works with decision makers with the authority and responsibility to make meaningful change. We have helped dozens of organizations to adopt a systemic approach to manage complexity and radically improve performance and growth for 25 years through our Decalogue management methodology. The Network of Projects organization design we developed is supported by our Ess3ntial software for multi-project finite scheduling based on the Critical Chain algorithm.
See our latest books Moving the Chains: An Operational Solution for Embracing Complexity in the Digital Age by our Founder Dr. Domenico Lepore, The Human Constraint – a digital business novel that has sold in 43 countries so far by Dr. Angela Montgomery and ‘Quality, Involvement, Flow: The Systemic Organization’ from CRC Press, New York by Dr. Domenico Lepore, Dr. .Angela Montgomery and Dr. Giovanni Siepe.


Leave a Reply