
In our previous post we looked at understanding variation and processes. In this post we continue with Step Three of the Decalogue Management Method, “Make the system stable (understand variation and its impact on the network)” by looking at gathering data and why that matters.
What leaders and managers have to bear in mind is that people work in the system, while the job of the leaders/managers is to work on the system to continuously improve it. Everybody is supposed to give his/her contribution in order to achieve the goal.
Specifically, what do leaders/managers have to do? In order to take the right actions and make effective decisions they have to make sure they work in a “predictable” environment. This means that all the efforts have to be directed toward reducing variation inside the system. But first, we have to learn how to understand the nature of variation the system is affected by.
There are two kinds of variation. The first kind is intrinsic; intrinsic variation is the reason why life is tough, interesting and at times comical (entropy exists). The second kind of variation, due to external causes, always takes us by surprise (e.g., an earthquake). Learning how to distinguish one kind of variation from the other is crucial for a leader/manager. Why? Because the actions we have to perform in order to deal with those two different types of variation are completely different from each other.
Gathering Data to work with variation
In order to manage and improve processes, we need to gather relevant data and learn how to interpret the relevant data from the processes. The purpose of collecting data is to have a basis for taking appropriate actions to improve our processes.
What kind of data do we need? We start by flowcharting the processes.
“If you can’t describe what you are doing as a process, you don’t know what you are doing,” W. Edwards Deming
Once we have our flowcharts we can decide to apply what is known as Statistical Process Control (SPC). This is a lot more inspiring than it sounds. SPC, far from being a technique, is a “way of thinking.” This is because an intelligent use of SPC allows us to take meaningful actions to improve the system.
The first fundamental step is to choose what to monitor about the system and where.
Collecting data is not a simple exercise. The kinds of data, and the way we collect them, have a strong impact on our perception of how the system operates. We can choose to monitor the KQC that we mentioned in the previous post on flowcharting.
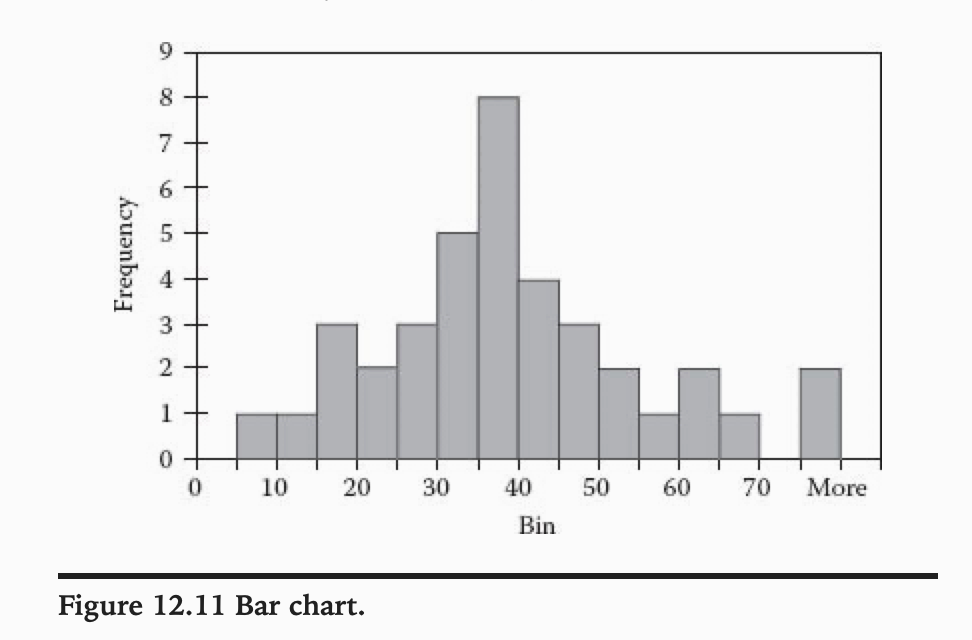
But given a set of data, how do we summarize and organize them so that we can “listen to the voice of the process”? We have to bear in mind that our purpose is to extract useful and practical information from the data. We could use a histogram, or bar chart, that shows us the data with possible values along one axis and their frequency along the other.
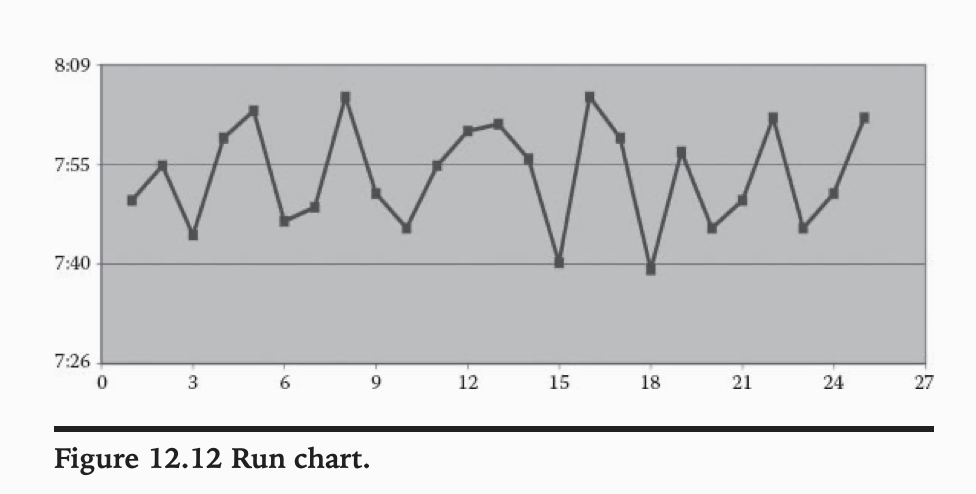
But this is a very limited way to display and summarize data on a chart. A run chart, instead, shows us how the data evolve over time. Time is a key variable as far as our understanding of the system is concerned.
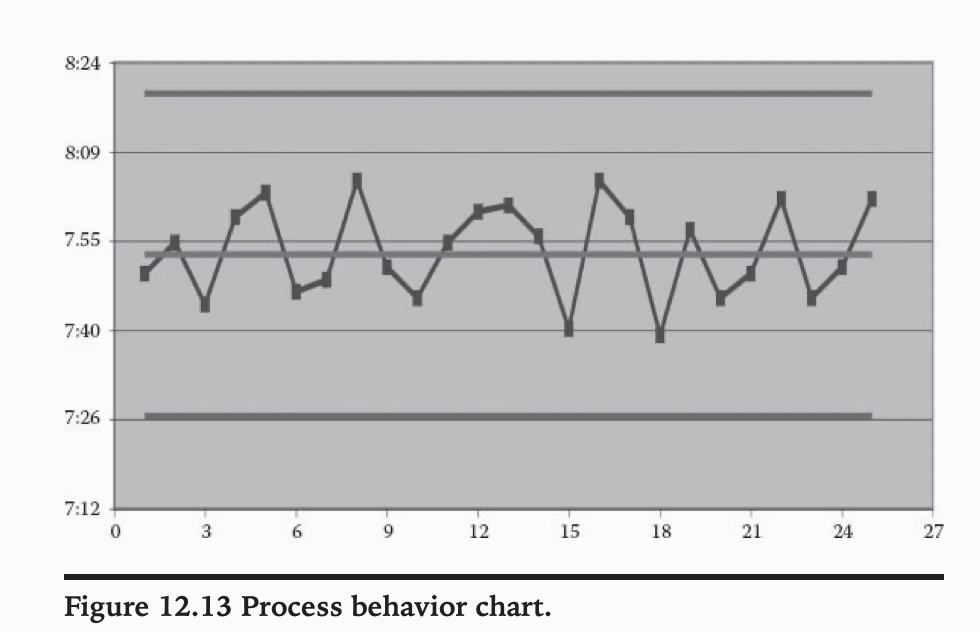
But we have to take a step further. In order to understand the variation that the system is affected by, we have to be able to identify the nature of the oscillation of the processes, that is, to put that oscillation into a context. To do so we use what is known as a process behavior chart (also known as control chart). This shows us the evolution of the data of a process over time measured against their average value and their natural limits of oscillation.
So what are we trying to find out from our data in the process behavior chart? As we mentioned before, there are two kinds of variation. The first one is due to causes intrinsic to the process. These causes are always present, in every production batch, with every operator, in every step of the process, in every action we perform. They are called “common,” or “intrinsic” causes.
The second kind of variation is due to assignable causes that are “external” to the process. When the process is affected by intrinsic causes of variation, we say that the process is predictable (or in statistical control) because it is subject to variation that is statistically stable over time. The behavior of such a process is predictable (within certain limits of oscillation) over time.
When a process is affected by assignable causes of variation, we say that the process is unpredictable (out of control), as it is subject to variation that is not statistically stable over time. We cannot “predict” over time the behavior of such a process.
The word “predictability” is often misunderstood. Dr. Walter Shewhart, a physicist (and Deming’s teacher) who worked at Bell Laboratories at the beginning of the twentieth century, studied the problem of the nature of variation and the behavior of processes affected by it. It is useful to remember what Shewhart said in this regard:
A phenomenon will be said to be controlled when, through the use of past experience, we can predict, at least within limits, how the phenomenon may be expected to vary in the future. (W. A. Shewhart, Economic Control of Quality of Manufactured Product, Van Nostrand, New York. 1931; reprinted by the American Society for Quality Control (1980), p. 6.)
The problem was then to determine how to quantify the one and/or the other kind of variation detected, and how to make practical use of the information. It was clear that some kind of statistics was necessary to deal with the issue. The foundations of the branch of statistics used to determine the nature of variation in processes called SPC were formulated by Shewhart himself.
Shewhart started from the following question: if a parameter of a process oscillates, what are the limits of oscillation for determining whether that variation is due to intrinsic causes?
The answer he gave is simple: he used sigma, the “standard deviation” of the variable in question, as a unit of measure for variation. Specifically, he stated that variation limits placed at 3-sigma set the “boundaries” for the variation of a process due only to intrinsic causes.
If the process oscillates between ± 3-sigma from its average, the oscillation is, in principle, due only to intrinsic causes.
Although sigma is a statistical parameter, the use of 3-sigma does not come from “statistical” considerations; the choice of 3-sigma does of course emerge from a statistical understanding of the phenomenon of variation, but it is set for strategic, economical and empirical reasons.
Shewhart understood that statistics have to support the process of decision making and should not set artificial rules on how processes are supposed to behave. As a consequence, in order to make informed decisions and act accordingly, the question was: where do we economically decide to put the limits for the intrinsic variation of a process?
We must do this because we must have a criterion to separate the “signal” (external causes of variation) from the “noise” (intrinsic causes of variation). We don’t want to mistake the one for the other and act without due reason, thus actually tampering with the system. Shewhart empirically decided that setting the limits for the intrinsic variation at 3-sigma was economically acceptable.
If we want to talk in statistical terms, we can say that the probability that the output of a process falls outside the 3-sigma limits “by chance” is extremely low. The knowledge we gain provides us with an operational procedure that allows us to know when to intervene. How do we know this? If the process oscillates within the 3-sigma limits, we say that it is affected only by intrinsic (to the process) variation and we do not need to intervene (unless we think the oscillation is so wide that it is not acceptable for the kind of activity in question). If, and when, the process shows data outside the limits, we know that something “unusual” (not intrinsic to the process) happened, and we have to check on the specific event and intervene coherently.
Try it for yourself
How to Make a Process Behavior Chart
The tool we use to monitor and measure the predictability of processes is the process behavior chart. It is worthwhile to stress again that using statistics in this way is not a straitjacket; we have to use it with intelligence as a “thinking” support for our actions.
A process behavior chart is drawn from the available data of the process; we collect the data, we calculate the “statistical average” of the data, and we derive from these data the inherent 3-sigma limits that allow us to build the upper and lower limits of oscillation in the chart.
Although there is no precise rule on how much data we actually need to calculate the limits, we recommend having at least 15–20 points. This does not mean we cannot draw a chart with 10 data points; we only have to understand that the limits are less reliable.
To determine if a process is affected by external causes of variation, we do not use just one criterion. A time-honored method (originally developed at GE) is the following:
Any process is affected by external causes of variation (hence we can consider it as statistically unpredictable) when:
- One data point falls outside the 3-sigma limits
- Two data points out of three fall on the same side of the central line beyond 2-sigma
- Four data points out of five fall on the same side of the central line beyond 1-sigma
- At least eight consecutive points fall on the same side of the central line
See Part 8 in this series ‘Why Your Organizations Constraints are the Key to Success’
PREVIOUS POSTS IN THIS SERIES:
Radically Improving Organizational Performance – A Systemic Approach to Management Part 1
Leadership for Complex Times – A Systemic Approach to Management Part 5
To find out more about ten guided steps to a systemic leap for your company, contact Angela Montgomery at intelligentmanagement@sechel.ws
SCHEDULE AN INTRODUCTORY CALL WITH US
Intelligent Management works with decision makers with the authority and responsibility to make meaningful change. We have helped dozens of organizations to adopt a systemic approach to manage complexity and radically improve performance and growth for 25 years through our Decalogue management methodology. The Network of Projects organization design we developed is supported by our Ess3ntial software for multi-project finite scheduling based on the Critical Chain algorithm.
See our latest books Moving the Chains: An Operational Solution for Embracing Complexity in the Digital Age by our Founder Dr. Domenico Lepore, The Human Constraint – a digital business novel that has sold in 43 countries so far by Dr. Angela Montgomery and ‘Quality, Involvement, Flow: The Systemic Organization’ from CRC Press, New York by Dr. Domenico Lepore, Dr. .Angela Montgomery and Dr. Giovanni Siepe.


Leave a Reply