“The point is, May, management has to be guided by deep knowledge of the system and all its interactions. First of all you have to see those patterns, then you need to be able to monitor and measure them. You have to gain a statistical understanding, otherwise even if things look like they are going well, if you don’t have a deep statistical understanding of your processes, then you really don’t know what’s happening.”
How can managers really know what’s happening?
What Sam is referring to in this chapter is the ability to see the whole system of an organization. If a company is organized as a traditional hierarchy, this can be very difficult to do. The traditional, hierarchical model stems for a world view of ‘çommand and control’. The logic behind this is that adding hierarchical levels increases the personal capacity of individual managers for control. But if we want to increase the capacity to listen to the customers and the suppliers, so as to satisfy the needs of the market, the hierarchical model is a hindrance.
An alternative model
The model that Sam proposes, instead, is “the enterprise as a system”, a direct reference to Dr. Deming’s model of “production viewed as a system”, as we saw in Chapter 1 of this knowledge base. The diagram below shows how the organization of Maidenhead Metals looks based on this systemic model. The interdependencies with the suppliers and customers, the feedback cycle and the constraint as Replenishment are clearly shown.
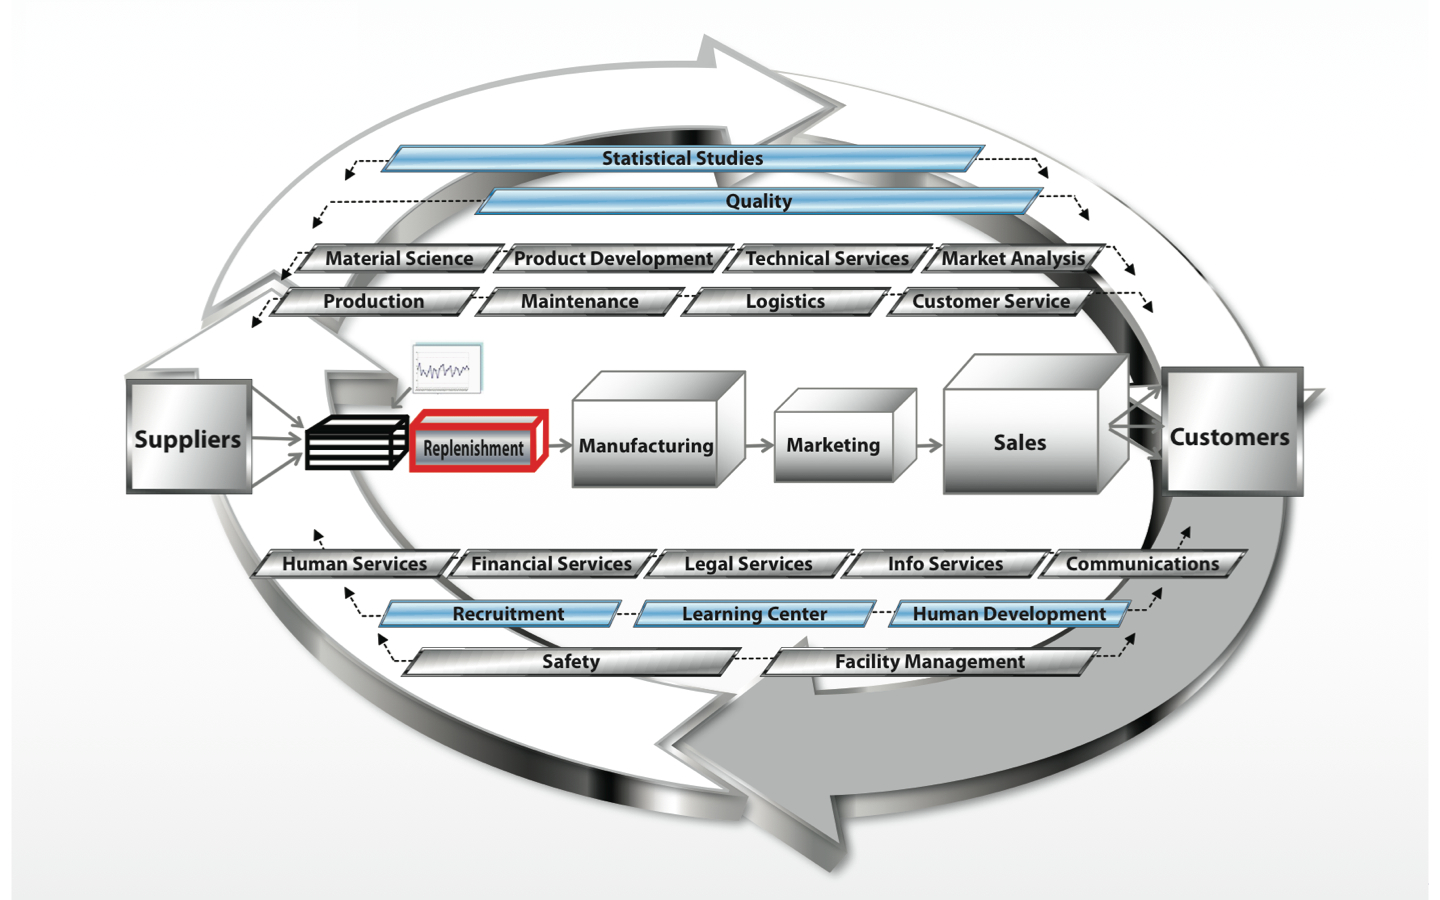
Maidenhead Metals Redesigned as a System around a Constraint
The adoption of this model automatically includes in the picture customers, suppliers, and interdependencies, which are completely absent in the hierarchical model. But this approach alone is not enough to manage an organization effectively. The capacity of a system/network of interdependent components to achieve its goal is limited by a very small number of factors, indeed often only one: the constraint. The constraint of Maidenhead Metals is shown in the red box and it is Replenishment.
The constraint as focus and leverage point
Whether you are aware of it or not, every system has a constraint. The constraint is what determines the pace/speed at with which a system generates units of its goal. In for-profit companies the units of the goal are linked to the generation of cash profit (value).
A system that is balanced, i.e. where local efficiencies are pursued everywhere, is highly costly. A system that is instead unbalanced around its constraint is like a tube with one section that is narrower than the rest: there is one phase/process/group of resources with less capacity than all the others.
Why do we manage a system through its constraint? It is because an unbalanced system is simpler and cheaper to manage. In an unbalanced system everything revolves around the constraint phase, and a detailed plan is necessary for this phase only. This schedule allows us to manage the whole plant. Reducing (global) variation in an unbalanced system means concentrating on and investing in the constraint phase only, not every single part of the process.
If we have to manage a plant, then increasing the productivity or improving its performance is considerably cheaper, and less wasteful in terms of time and energy, if it is unbalanced around the constraint. This knowledge is the legacy of Dr. Eli Goldratt, creator of the Theory of Constraints.
See the patterns (Understanding processes)
A company is a complex system ruled by non-linear interactions that make it difficult to make any prediction when any change is effected. That’s why any approach to improve the system has to be “holistic”, i.e. address the whole system, and consider all the interactions/interdependencies.
The description of what everybody does, input and output, understanding the interdependencies and, finally, understanding the variation associated with each process, is foundational to any form of “intelligent management”.
The most practical way to understand processes is to draw a picture of them, by means of a flowchart. A flowchart is a diagram that describes a sequence of events, tasks and decisions that transform input in a process/system into output. Flowcharts use some standard symbols and conventions to make it easier to communicate and understand them and portray a process with a map or chain of activities and decisions.
We can describe the flow of materials, information and documentation; we can show the various activities included in the process, explain how these activities transform input into output, indicate the decisions that have to be made along the chain; we can design interrelations and interdependencies among the various phases of the process that are important, and we can easily acknowledge that the strength of a chain depends on its weakest link.
In describing processes we realize that it is very difficult to establish very precise borders between departments and functions. In order to deliver a product, or provide a service, these fictitious separations are often crossed. We see, therefore, that these processes cut across a traditional organization chart or organization pyramid. Flowcharts are then the key to developing understanding of if, how, and where every single link is adding value to the chain.
“…a flow diagram also assists us to predict what components of the system will be affected, and by how much, as a result of a proposed change in one or more components…” (Deming, The New Economics).
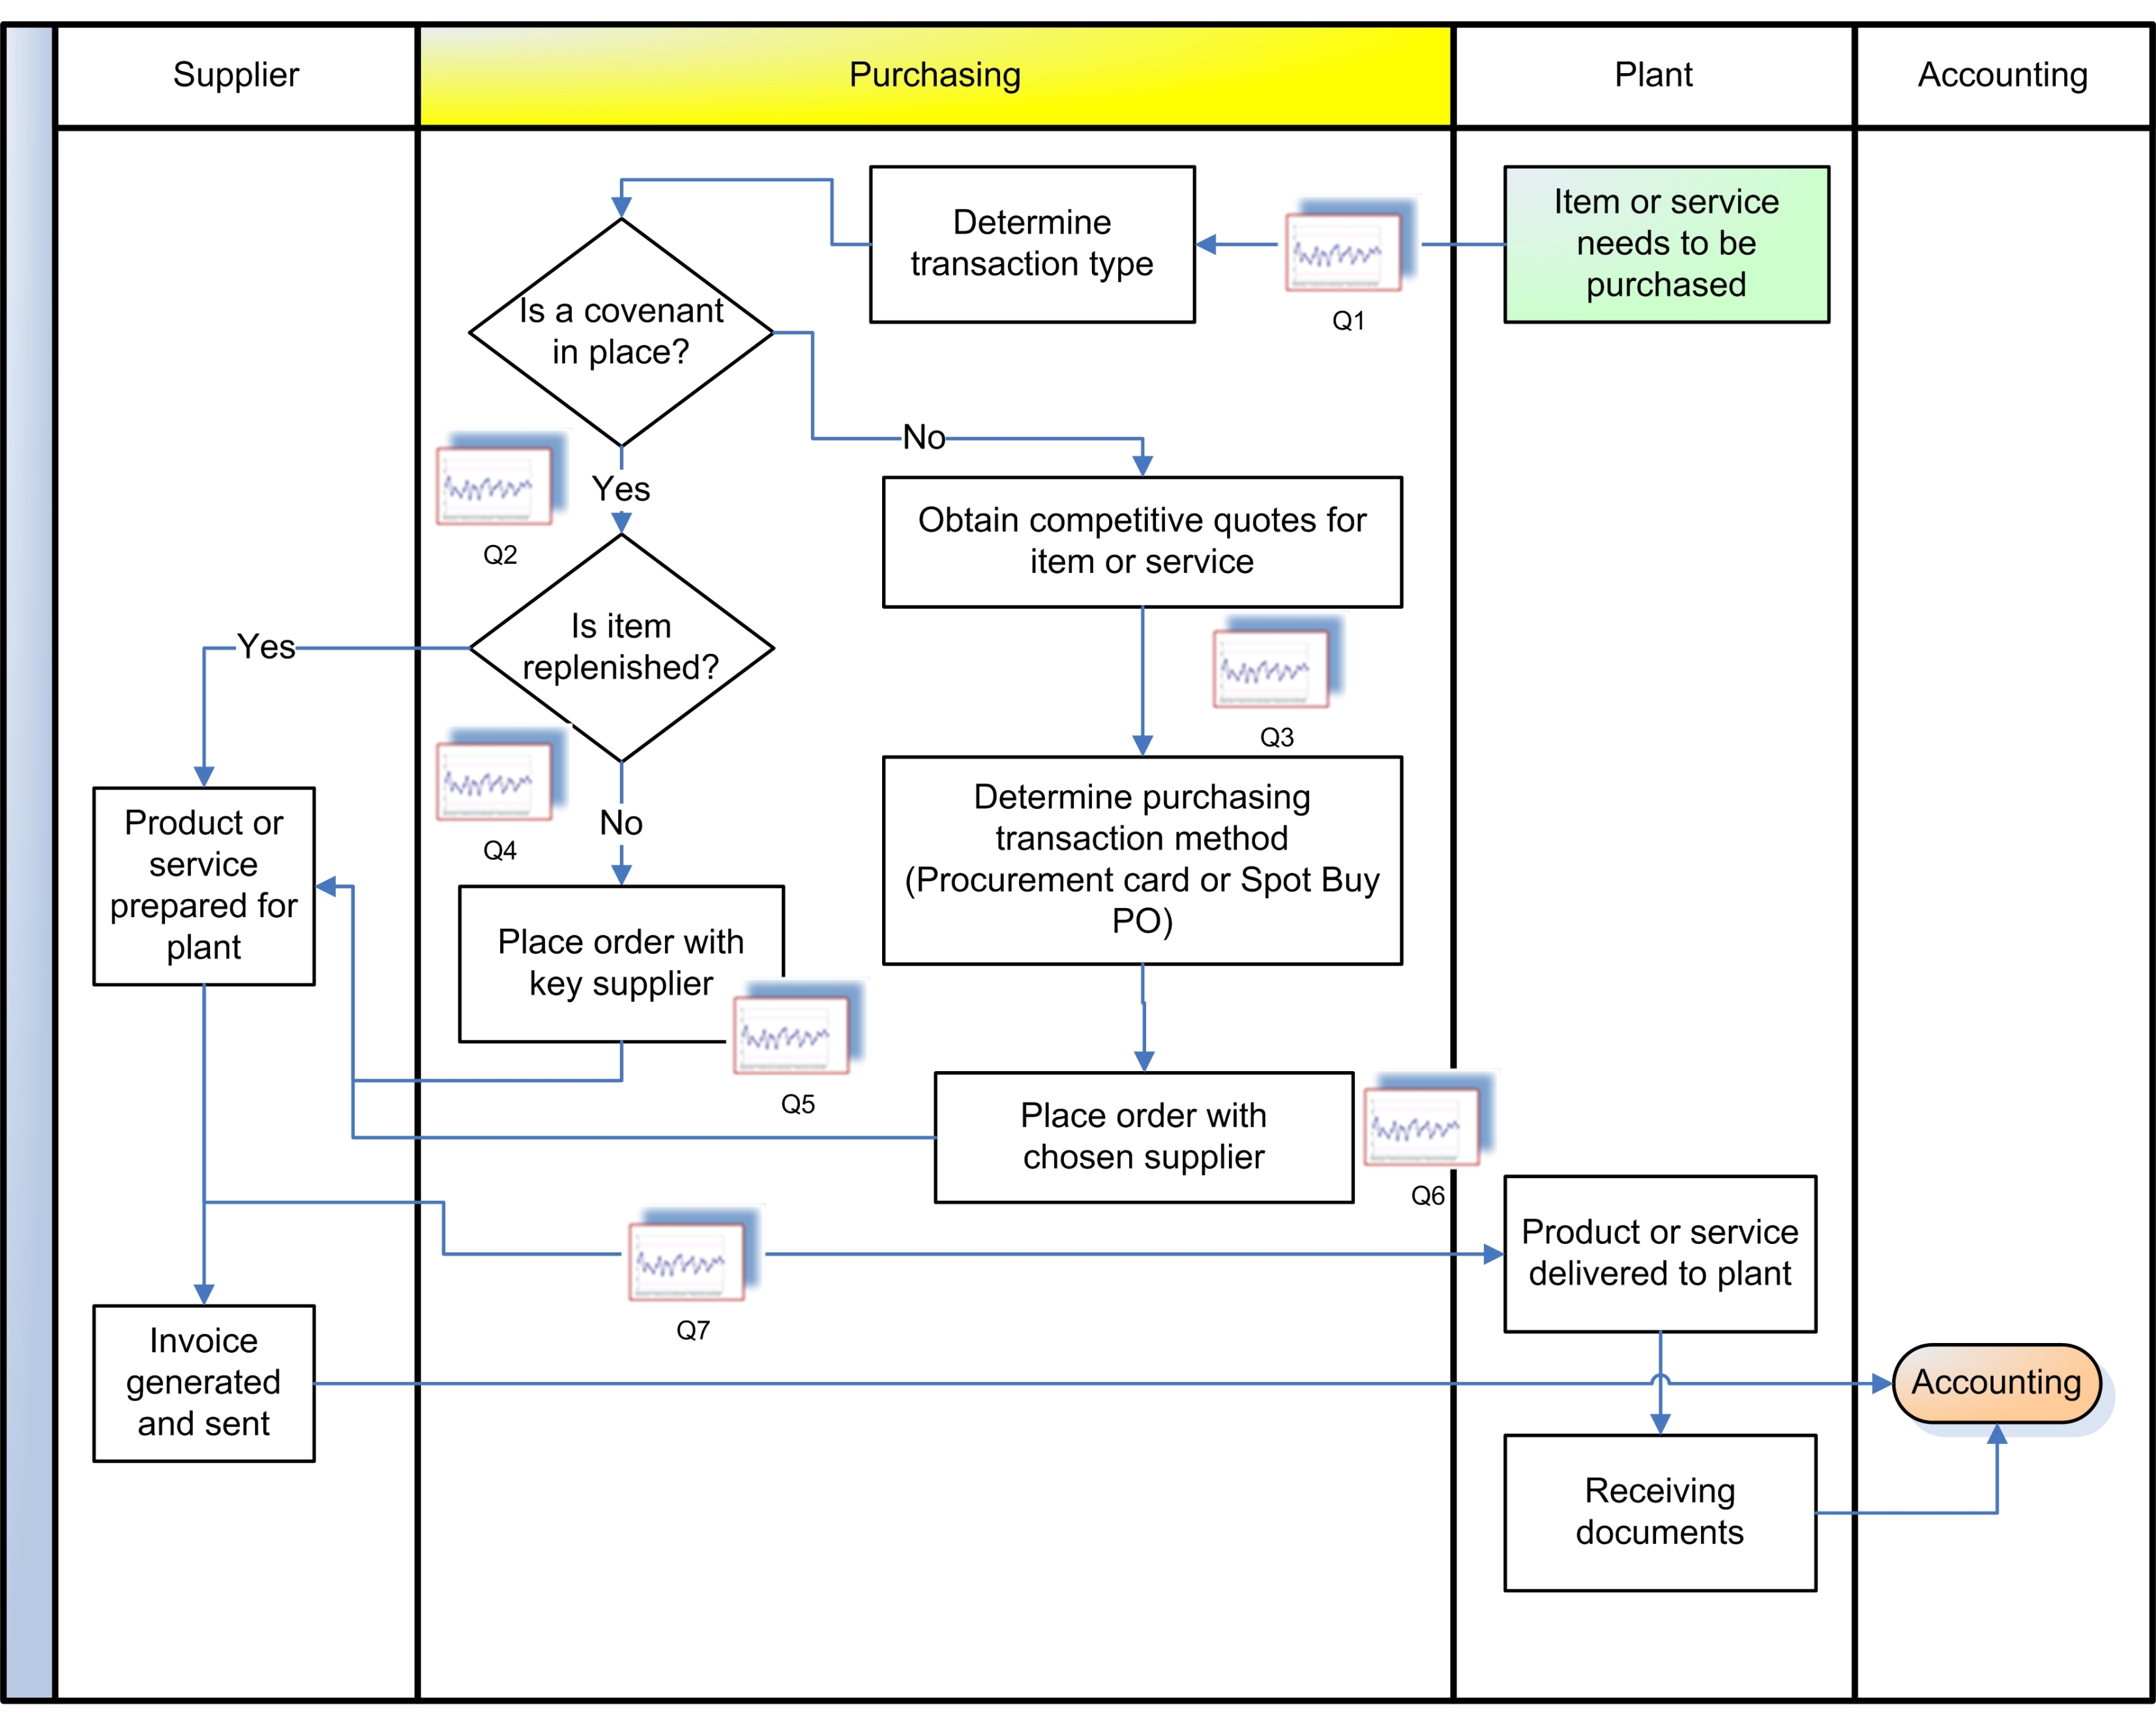
What we do is to map out processes and compare them with how they should ideally work, so as to understand where complications lie, identify misalignments between authority and responsibility if any, look for critical points, and determine breakage points in the chain that link the supplier with the customer.
Using Statistical Process Control to Understand the System
From this analysis we have to recognize ‘Key Quality Characteristics’ (KQC), i.e. aspects of the processes that heavily influence their capacity to contribute to the goal of the system. By highlighting these critical characteristics, we can identify the points where it is more useful to gather data on the variables of the processes. From the analysis of these data we can understand whether the processes are in control (predictable) or not before taking any action to improve them, and whether improvement actions are effective or not.
We use Statistical Process Control to distinguish between these two types of variation.
SPC provides us with an operational definition of how to obtain the maximum from our processes.
SPC uses what are known as “control charts”, or “process behaviour charts” to analyze variation.
A process behaviour chart is a time chart of a process (or the variables under consideration, e.g. the physical or chemical characteristics of a product) with three extra horizontal lines: the average value and the upper and lower limits of the process.
These limits are NOT specification limits. They indicate the intrinsic variation of the process. They are calculated using a statistical formula, using the actual data of the variables being studied. The meaning of these charts is not probabilistic but empirical and economic (W. Shewhart). The limits are fixed using the rule of 3sigma (sigma is the standard deviation, which measures the spread of the variable around its average value) i.e. they are placed at a distance of three “standard deviations” from the average value.
The reason for the choice of 3sigma is that 99% of 100% of data of a variable will be found at a distance of DELTA3 sigma from the average.
Once we have made a process behaviour chart, then how do we interpret it and use it?
When we have plotted the process, if the variable oscillates within the upper and lower limits, the process is said to be in control. If the oscillation goes beyond the limits, or if a series of points follows certain well-defined rules, the process is said to be out of control, or unstable.
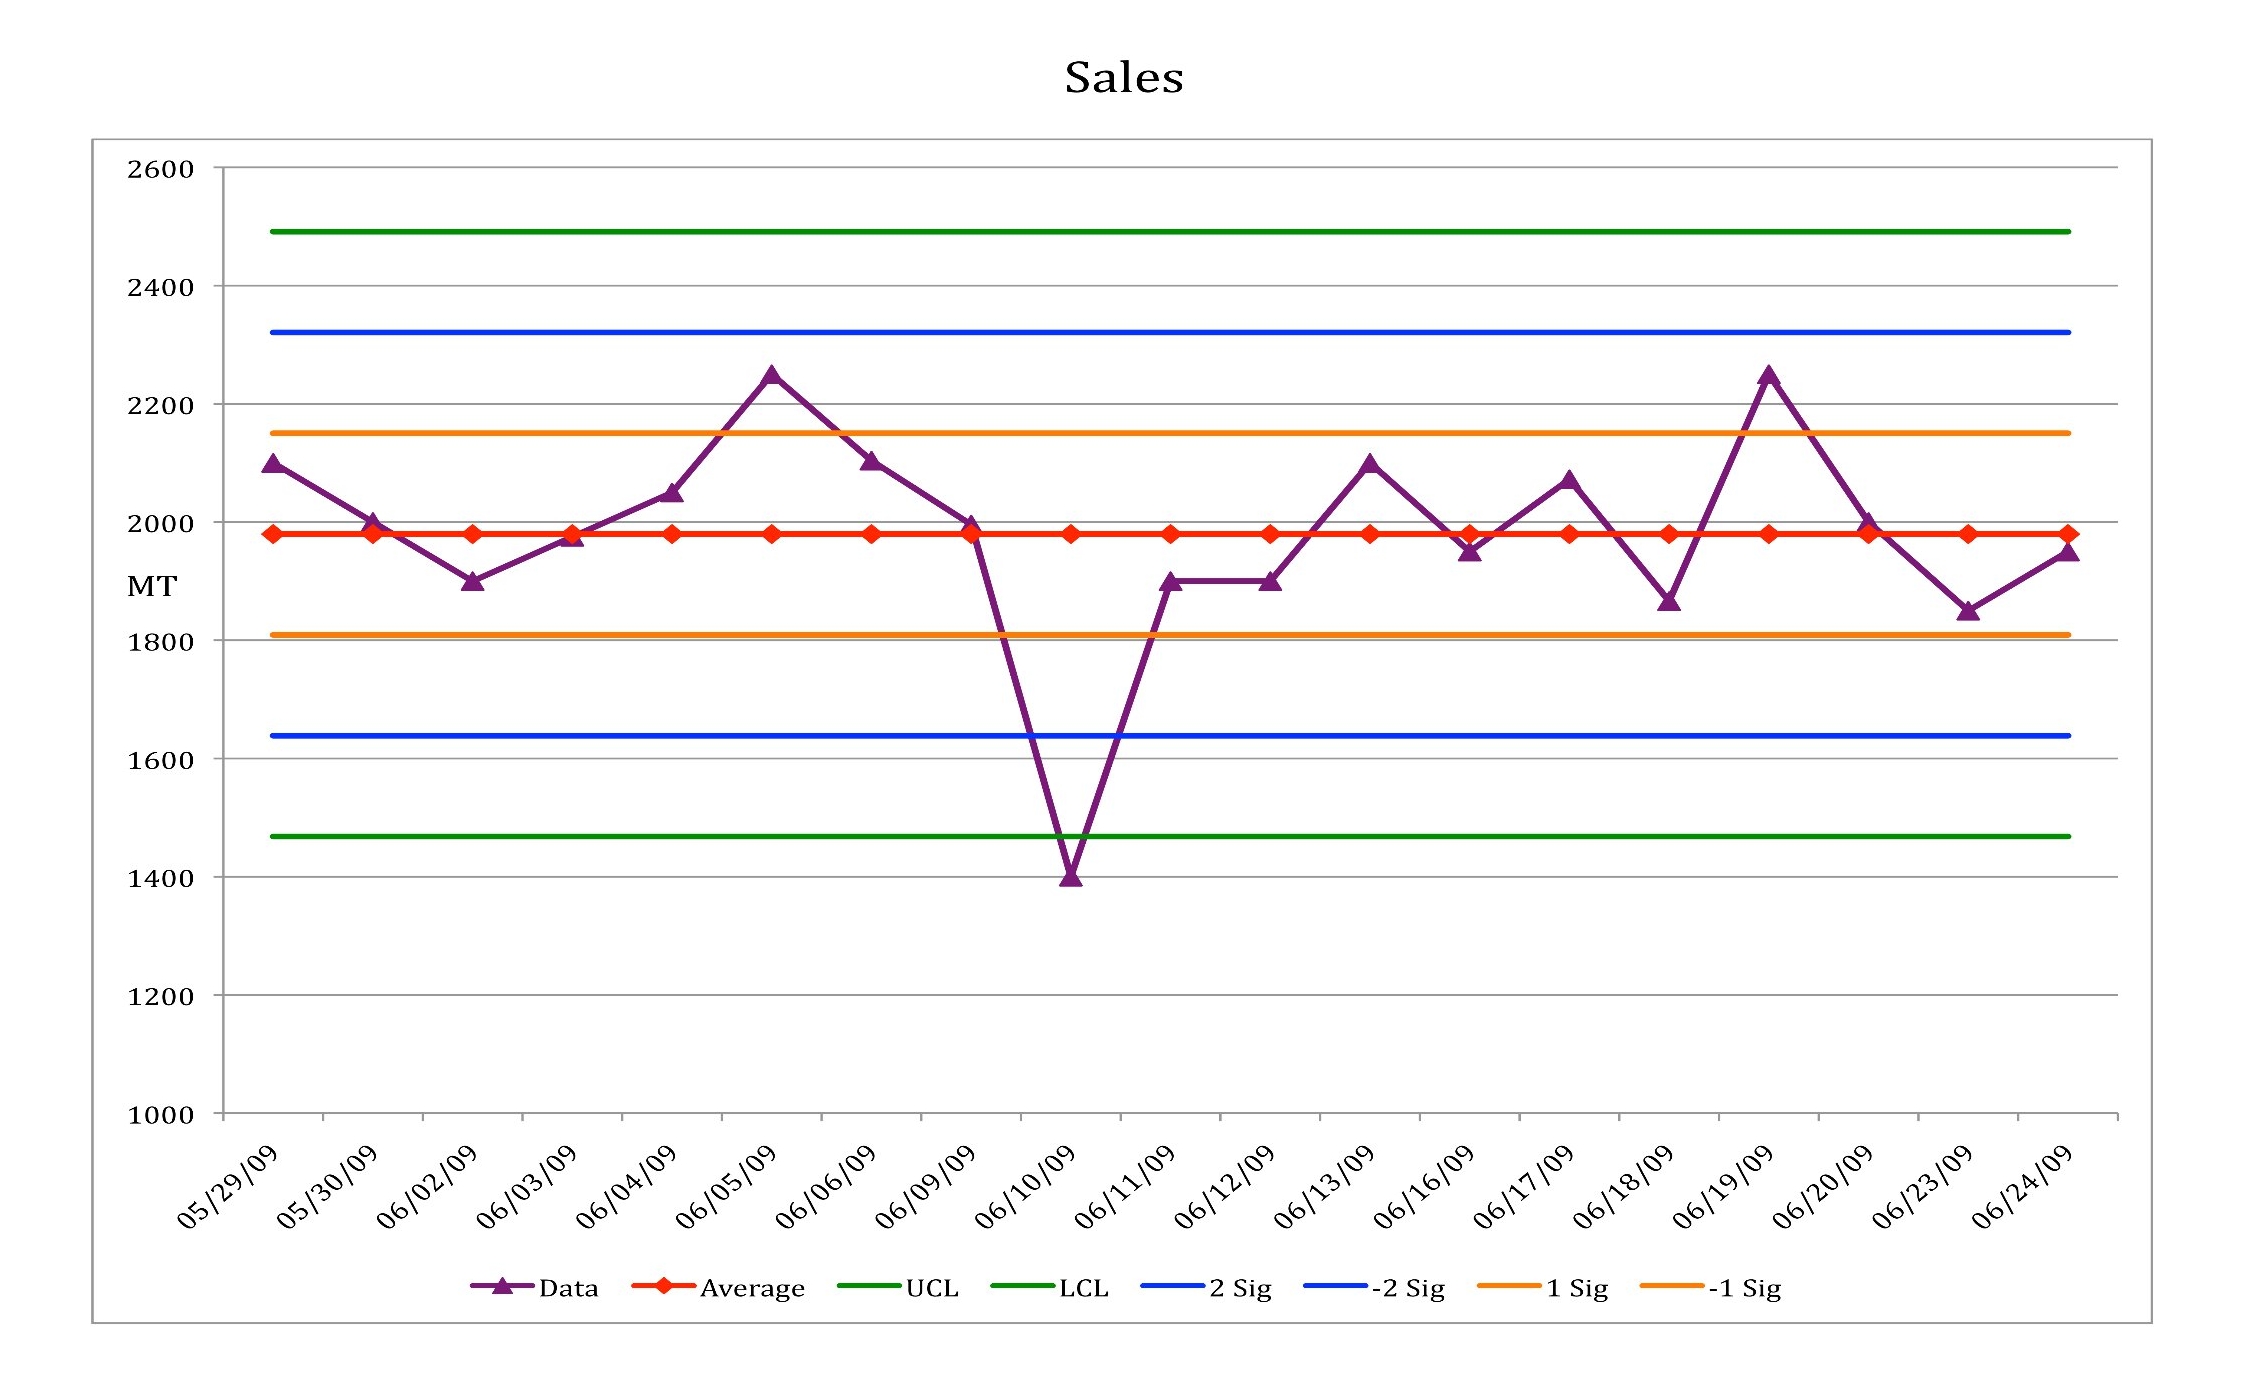
Out of control process
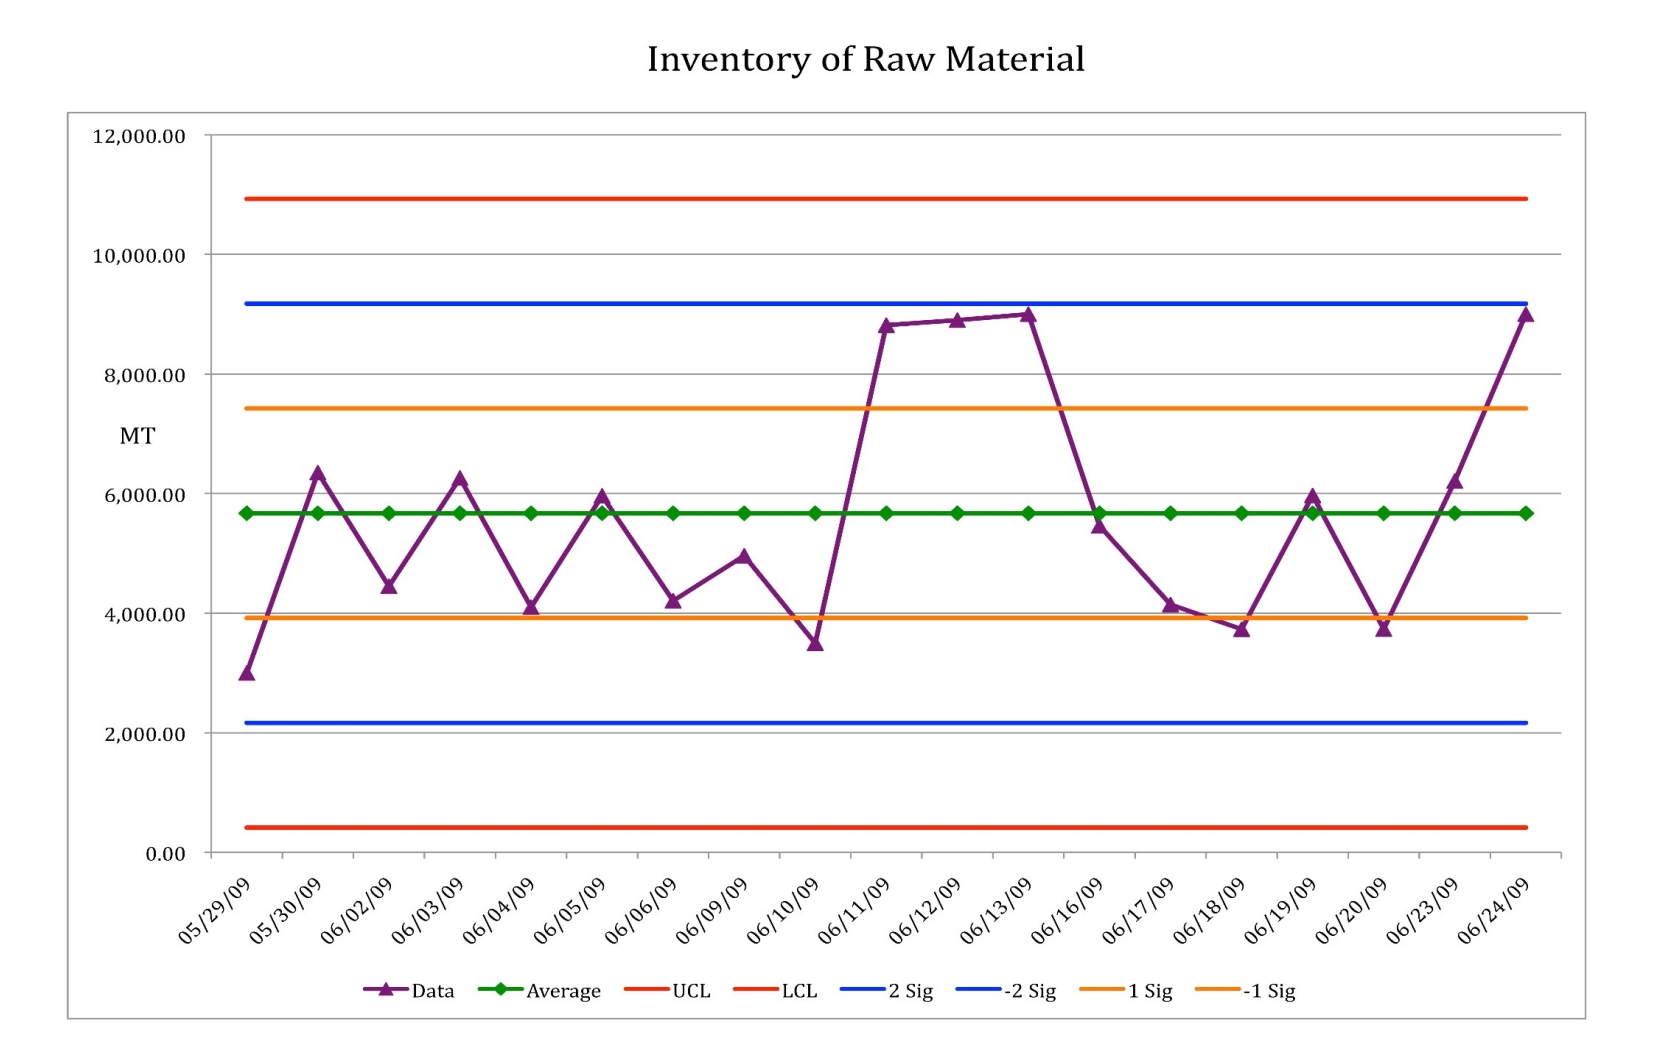
In control process
This distinction is of fundamental importance when we need to make decisions about improving the process, as the two causes of variation are fundamentally different.
In the case of normal causes, the process is stable and therefore we say that it is predictable. This means that on the basis of how the process behaves today, we can predict how it will behave tomorrow, i.e. always within the control limits. In the case of special causes, the process is unstable and therefore unpredictable. In other words, based on today’s behaviour, we are not able to predict anything about how the process will behave tomorrow.
We certainly prefer to have a process that is in control rather than out of control as we can predict its behaviour, and that makes any planning simpler. Improving a process that is in control entails reducing its intrinsic variation, and this is difficult precisely because it is based on procedures that are consolidated and stable. This can be achieved by stratifying and dividing up into categories the factors that influence the process in order to analyze them, and by applying the Deming cycle (Plan Do Study Act) in order to prepare experiments that will enable optimization.
Clearly, this is a complex procedure and, in some ways, disruptive as it introduces variation into the system, the effects of which we cannot know.
However, a stable process with high intrinsic variation is certainly not desirable, and we must make every effort to reduce that variation.
Paradoxically, a process that is out of control is easier to improve. We can detect a process that is out of control because there are points, or a series of points, on the control chart that lie outside the control limits, or that follow a precise patterns. In this case, it is easy to check the operational conditions related to those specific points, investigate the reasons for that behaviour and try to remove the special causes.
Avoiding chaos: Knowing when to act and when not to act
Process behaviour charts create an important distinction that helps us in the decision making process to understand when to act on the system and when not to act. It is a waste of time (and resources) to go and investigate a point on a control chart that “seems” too high or too low when a process is in control, i.e. predictable and affected only by normal causes of variation. Conversely, it is easier to establish where we need to act on a process if it displays special causes of variation.
The control limits are the “voice of the process”; they show us what we can achieve from a process, given the present conditions.
As we have already mentioned, this are NOT limits of specifications, which instead are the “voice of the customer”.
When we compare the limits of a process with specification limits, we can understand how many “out of specs” products the process in question will generate. If the specification limits are within the process limits, and the process is stable, then we will produce 100% of products to specification. If the specification limits are outside the limits of the process, and the process is stable, we will constantly and predictably produce a percentage of products that are not within specs. If the process is not stable, and the specification limits are within those of the process, then we are on the threshold of “chaos”, i.e. we get the impression that we are producing something to specification, but we will certainly begin producing products that are not within specs with no control over when or how.
Whenever the specification limits are outside of those of the process, then we are in a state of “chaos”.